Robust or Bust?

By Michael McDaniel, Chief Investment Officer

This week the US Federal Reserve voted unanimously to raise the Federal Funds Rate by 25 basis points.

Leading up to the decision, conventional wisdom was nearly unanimous. Journalists, economists, advisors and pontificators of all stripes expressed confidence that domestic bond yields, the US Dollar and equity markets would rise, while bond values and precious metals would crash.

Such conventional wisdom is based on things like past correlations, which some folks who claim to be able to “crash test” portfolios try to weave together to establish what complex events will do to complex and oft-unrelated asset classes.

We’ve taken a different approach with Nitrogen. Our objective approach to analyzing risk respects the fact that the market is an overwhelmingly complex and interconnected system. We don’t try to guess whether individual securities will rise or fall; we assess 95% probabilities of broad portfolio risk and return.

Nitrogen doesn’t purport to know what a given news event will mean for every market, asset class, sector or security. Instead, we arm advisors with a solution to convert their outlook on the markets into a comprehensive analysis of a portfolio’s risk — making the results truly actionable.

The market, and the math of risk, simply doesn’t care about conventional wisdom. An advisor heading into this week’s news cycle could have believed any of three possible outcomes for the US bond market: that it would head higher, head lower, or be unchanged. It’s simple for an advisor to have the risk model reflect their opinions with a click or two. Immediately, that advisor has a powerful understanding of portfolio risk, and can stress test various real-world market scenarios.

Weeks like this, where the market deviates from conventional wisdom, highlight the superiority of broad-based portfolio risk analysis vs. speculative crash testing that incorporates consensus views or strong historical bias.

Whether you believe the sky is blue or falling, the Risk Number is a powerful way to illustrate the efforts you’re making to protect your clients from downside risk. If we can help you do that more effectively, please let us know — we’d love to help.

Sacramento Business Journal: Nitrogen, Region’s ‘Best Places to Work’

staff

We are proud to be named one of Sactown’s Best Places to Work by the Sacramento Business Journal.  Our 90 Nitros get all the credit! Read the full release below and learn more about working with us at https://nitrogenwealth.com/careers.      

SACRAMENTO, CA–

  • Nitrogen honored by Sacramento Business Journal for its success in achieving exceptional employee satisfaction and engagement
  • Nitrogen’s inclusive culture, accountable and transparent leadership, and open communication helped earn this business community accolade

Riskalyze, the company that invented the Risk Number and delivered the world’s first risk alignment platform for financial advisors, was named one of the region’s “Best Places to Work in 2015” by the Sacramento Business Journal. The award recognizes Sacramento-area companies that are demonstrably successful at maintaining a high level of engagement and satisfaction among their employees.

In its article featuring Nitrogen, the Sacramento Business Journal specifically recognized the company’s inclusive culture, accountable and transparent leadership, and open communication, among other qualities. Traditional perks, such as limitless vacation time, stock options, or social events, are outweighed by larger benefits – namely, the freedom Nitrogen’s senior leadership grants to their employees, and the opportunities for growth and advancement available to employees at all career levels. By showing their employees that their time and effort is deeply valued, Nitrogen has earned its reputation and ranking as one of Sacramento’s Best Places to Work.

“This award is for the 90 Nitros who work their hearts out every day to deliver great solutions that are making millions of investors and thousands of advisors more successful every day,” said Aaron Klein, CEO at Nitrogen. “When you bring together some of the brightest minds on the planet to solve big problems, that makes for an energetic workplace of people on a mission. I love coming to work every day precisely because I get to work with them.”

Each year, American City Business Journals commissions Quantum Workplace to facilitate a third party employee engagement survey to the region’s private companies. With a focus on ways in which companies create opportunities for their staff, how leadership ensures employees feel valued, and the perks available to their staff, the winning companies were selected in four size categories based on local FTE employee survey responses and response rates.

For more information about Nitrogen, please visit www.riskalyze.com.

For media inquiries, please contact riskalyze@ficommpartners.com.

About Nitrogen

Nitrogen is the company that invented the Risk Number, which powers the world’s first Risk Alignment Platform, empowers advisors to execute the digital advice business model with Autopilot, and enables compliance teams to spot issues, develop real-time visibility and navigate changing fiduciary rules with Compliance Cloud. Advisors, broker-dealers, RIAs, asset managers, custodians and clearing firms today manage $121 billion on Nitrogen’s platform in pursuit of its mission to align the world’s investments with each investor’s Risk Number. To learn more, visit www.riskalyze.com.

Introducing Risk Targets

From the first time an advisor used the Risk Number to help a client understand the comparison between how they’re invested today and how they want to be invested tomorrow, we’ve had advisors asking the question: is there an alternative to using a risk questionnaire to establish how much risk the client wants?

There are a variety of reasons why. Some advisors just don’t want the client experience to feel like “homework” and prefer discussing the Risk Number of the client’s portfolio to establish how much risk they want. Others work with an institution that mandates a particular risk questionnaire and they don’t want to use two. Still more use Risk Questionnaires in some circumstances but prefer not to in others.

For all of those advisors, we’re excited today to announce the launch of Risk Targets.

Now, when it’s time to set a client’s Risk Number, you have two easy choices — set a Risk Target, or use a questionnaire.

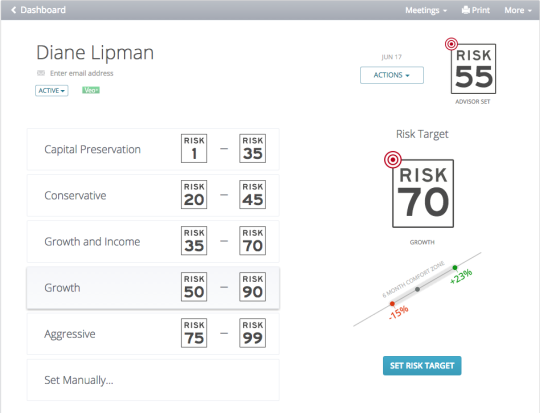
When you set a Risk Target, you’ll see a set of preset ranges, or you can click Set Manually and pick the exact Risk Number you prefer. When you set a Risk Target, you’ll see a red target icon on the upper left of the Risk Number, to signal that it’s a target.

Of course, you can still use the Risk Questionnaire that you know and love, whenever you find it appropriate. The simple and detailed questionnaires have had some nice design upgrades as well with this new release. In particular, the updated simple questionnaire features a redesigned set of questions that takes its accuracy levels to the next level, while still only requiring four easy questions.
Risk Targets and the design enhancements to risk questionnaires are a free upgrade for every Nitrogen customer, and will begin rolling out to all of our customers starting next Tuesday.

To see Risk Targets and the updated risk questionnaires in action, join an upcoming guided tour. We look forward to your feedback.

Nitrogen Reinvents the Client Meeting

 
image

We’ve watched as advisors have used a variety of methods to share the Nitrogen insights and analysis they’ve built with their clients. We’ve had lots of discussion as an industry about the technology we can use to do this — from an office iPad you can hand to a client, to WebEx for sharing your screen.

But those solutions are very challenging in the real world. People often can’t get the WebEx plugin installed in their browser, or find Skype in their downloads folder. The iPad keeps signing itself out, and you have to fiddle with passwords in front of the client.

And if by some miracle the technology can get working, it’s still a high blood pressure experience — did I hide the email notifications? Am I pulling up the right client’s information? Am I showing the wrong data to the wrong client?

We asked ourselves — what if this was easy? What if it was absolutely seamless, with no plugins or software to install, no passwords to remember, with bulletproof security and it just worked?

Today, Nitrogen reinvents the client meeting.

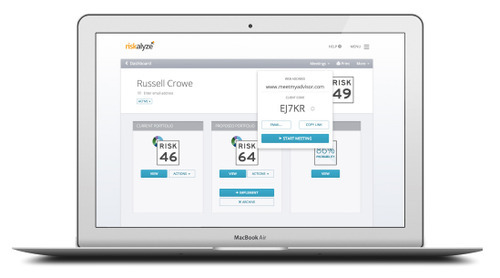
With Meetings built into Nitrogen, you can effortlessly launch a meeting with just two clicks. Your client only needs a web browser to join the meeting. It’s absolutely secure, and there’s no way to share the wrong data with the wrong client.

Your clients can watch you manipulate portfolios and Retirement Maps, help them capture their Risk Number, or you can even beam a risk questionnaire to their device to fill out.

Meetings is an incredibly powerful way to engage your clients — whether they’re across the room, or across the world. It’s set to launch on Monday, February 23, and is a free upgrade for all of our customers on the Solo, Team and Enterprise plans. (If you’re on a legacy plan or aren’t sure what plan you have, chat with our support team and we’ll be glad to help you figure it out!)

Long Term Consensus, Interest Rates and the Nitrogen Philosophy

By Mike McDaniel, Chief Investment Officer

In April 2013 I was heckled while on stage at an advisor conference as I demoed the Nitrogen Interest Rate Stress Test feature.  

As a part of my demo I suggested an advisor may want to stress test a given portfolio (prospective client or existing client) by assuming a 100 basis point rise in the 10 Year US gov bond yield over the next 6 months.  As I demoed the impact of a rising interest rate environment I was interrupted by passionate advisors in attendance.

“Interest rates don’t move like that!” one advisor shouted.  “How about something more reasonable!?” shouted another. Perhaps the most prudent question thrown my way was  “Why does Nitrogen assume a flat interest rate environment as consensus, anyways?

Out of the box Nitrogen works with a “long term consensus data model” which establishes the direction (up or down) and magnitude (how much) change on “the stock market” and “the bond market.” The Nitrogen default data model (a.k.a. “Long Term Consensus”) return expectation for interest rate sensitive investments assumes a “flat” interest rate environment.  

Monetary policy, economic growth rates, and other data points could be used to support a myriad of different ‘consensus’ views on interest rates. We constantly review and reserve the right to update the consensus inputs. 

Throughout 2014 we have read more and more analysis pointing to a rising interest environment.  We certainly accept that interest rates could (should?) be rising as monetary policy shifts to a less manipulative stance and the economy gains traction. On the other hand, one has to believe that monetary policy will allow interest rates to rise (at great expense to economic growth and interest expense to debt laden governments) and that economic growth is actually strengthening.   Rather than choose a side we have opted to model a “flat” interest rate environment in the “Long Term Consensus” data model.  

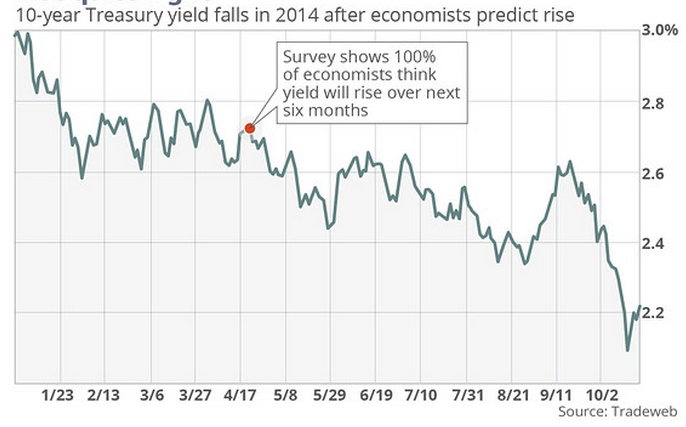
As I reviewed our consensus stance today I came across a GREAT data point on Marketwatch noting that 100% of economists were wrong about the direction/magnitude of change on the 10 Year US Gov bond yield over the past 6 months.  

Screen Shot 2014-10-21 at 4.40.48 PM.png

Though this data point is a bit anecdotal, it helps us express why we don’t attach our consensus data model to subjective surveys and why we continue to model a “flat” interest rate environment in our default data model.   

By the way, just four months after being heckled during my demo the yield on the 10 Year US Gov bond had, in fact, risen by more than 1% (from May 1, 2013 through September 5, 2013 the yield rose by 134 basis points from 1.63% to 2.97%).

And the Average Risk Number is…

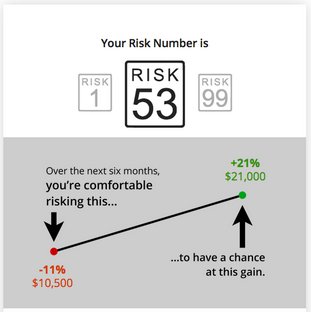
In May 2012, Nobel Prize winner, father of Prospect Theory and behavioral finance guru Daniel Kahneman told a CFA Institute audience of industry experts that “the single most important function of a financial advisor is to find out how much loss an investor can tolerate.”Believe it or not, we’ve analyzed the risk tolerance for over $14 billion in investments through our risk questionnaires. (We did eliminate all the outliers from that number — we’re fairly certain Warren Buffett hasn’t captured his Risk Number…yet.)Looking at that data in totality, the average investor’s Risk Number is 53. That means the average investor is comfortable risking 11% of their portfolio’s value within a six month period, before they begin to act irrationally and make hasty, emotionally-charged investing decisions.

Risk Number

A risk number 53 matches the risk in a typical balanced portfolio with a 60% stock and 40% bond allocation. This means that the average investor may not be psychologically capable of having more than 60% of their portfolio in the stock market.

portfolio

This should be concerning news to advisors who allocate portfolios using old fashioned rules of thumb, unquantifiable jargon such as “conservative” or “moderate,” or those who put each investor into a one-size-fits-all allocation. It should be equally concerning to advisors who are still using outdated, subjective and qualitative risk tolerance surveys.

Think for a moment about what makes your phone ring. When and why do clients start calling? After a 5% market drop? After a 10% correction? A 20% crash?

This has many implications for practicing advisors. Whether you’re a Nitrogen user or not, an advisor that recommends more than 60% equities to any investor should clearly be documenting an objective reason for doing so. It also suggests that any portfolio with a projected downside greater than 11% over a six-month period warrants a deeper risk/reward discussion with the investor.

High risk can equal high yield, but only if the investor has the stomach to stay invested that way for the long run. That’s why investing people within the bounds of their Risk Number is such a powerful way to harness human behavior and drive client success.

If we can help you with evaluating the risk alignment of your client base, don’t hesitate to let us know!

Contact Us

Introducing Retirement Maps

One of the things we’re good at as a company is distilling an idea into its most basic form, and turning that idea into a product that has a revolutionary impact.

We did it when we invented the Risk Number, and gave advisors a way to pinpoint how much risk a client can truly handle in their portfolio.

We did it again when we built the portfolio tools that help advisors win new clients with amazing risk analytics, and keep them by consistently beating the expectations game.

And today, we’re doing it all over again. We’re excited to introduce Retirement Maps.

There are many great tools to build comprehensive financial plans. If you’re looking for a tool that can analyze Social Security, calculate a personal balance sheet and set goals for acquiring large assets, our friends at FinanceLogix, MoneyGuidePro and eMoney have great solutions.

We heard advisors asking for something simpler. After they pinpoint a client’s risk tolerance and engineered the portfolio to fit, they wanted a fast, simple way to answer the question: can the client invest this way and reach their goals?

There was a big challenge to that. No matter how much computing horsepower you throw at it, Monte Carlo is still a notoriously slow and inefficient way to answer that question. We wanted to deliver far greater accuracy, but do it instantly.

After thousands of hours of research and development, our Core Technology team invented a new way to deterministically calculate the 95% probability years into the future. There’s no waiting for a long, slow recalculation: you get an interactive way to build a map for the client’s retirement right in front of their very eyes.

So you can actually lead your clients through the development of this map in real time, helping them to make the decisions necessary to achieve a high probability of success.

Retirement Maps also naturally discover held-away assets, opening up discussions to grow your assets under management. And nothing builds a prospect’s confidence like seeing that you understand how to build a portfolio that both fits their risk tolerance and their goals.

Best of all, we’ve made Retirement Maps a free upgrade for all of our existing customers, and for a limited time, a lifetime free upgrade for our new customers as well.

If you’re one of our amazing customers already, check your email for an invite to a special training session to learn how to put Retirement Maps to work in your practice.

Taking the Next Step in Portfolio Risk Modeling

Today, we’re excited to announce the launch of several key enhancements to the data model we use to calculate the risk in portfolios, the user interface for controlling that data model, and several new one-click stress tests you can run on your portfolios.

First, we added several enhancements to the data model. We now detect bond holdings, and we correlate those interest rate-dependent investments to the 10 Year US Treasury Rate. No need to turn on the interest rate stress test to see the analysis in that light any more. And we also detect tactically managed funds and have improved how we assess their risk.

Second, we rolled out a brand new interface to control the data model assumptions in your portfolio.

portfolio

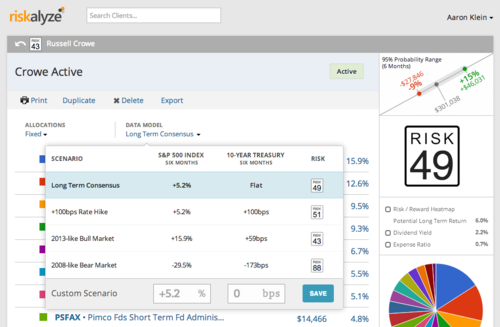
The default scenario, Long Term Consensus, is the same scenario we’ve always used for the S&P 500 — a long term annual gain of 10.4% (including dividends). Because interest rates, managed by central bankers, have no long term consensus per se, the default is “flat.”

By the way, notice that you can actually see what the Risk Number for the portfolio would be, without having to select that scenario and let the portfolio recalc! We know that’s a big time saver for some of you who love stress testing.

Third, we’ve added several one-click stress tests you can run on your portfolios. The +100bps rate hike keeps the status quo for the market, but raises interest rates by 1%. The 2013-like and 2008-like scenarios apply the S&P and interest rate changes for those quite-opposite market years.

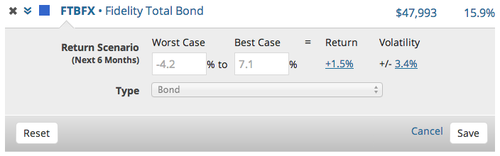
Remember — if you want to see how these assumptions calculate into any individual investment, simply click the arrows beside each one to pop open and see the best case / worst case, or return / volatility calculations for that individual fund or stock.

funds

We hope you enjoy how simple it is to understand and control the underlying assumptions in your portfolio risk calculations. These changes are now live for all Nitrogen customers.

A One-Click Roadmap for Your Clients

The role of an advisor is a paradox. On the one hand, clients want their advisors to “take care of their money,” but on the other hand, it’s impossible to do that job without engagement, agreement and buy-in from those clients. One way that advisors have been building that engagement is to use an Investment Policy Statement to discuss and build agreement about the direction of a client’s portfolio. The IPS illustrates the facts we know about the client, and showcases the direction we’re going to take a client’s investments.

Today, we’re excited to announce that Nitrogen now makes it possible to create this roadmap for your clients with a single click. We’ve built a printable Investment Policy Statement that is simple and understandable, yet includes all of the key elements advisors need in that document.

And here’s the best news of all. While the Investment Policy Statement will be an add-on product in the future, every single Nitrogen customer just got a lifetime upgrade to the IPS — completely free. And for a limited time, every new advisor who joins Nitrogen will get the lifetime upgrade, too.

There may be some advisors who have more comprehensive needs in an IPS document. We made the choice to err on the side of simplicity for a key reason — the best guidance we have from FINRA is that understandability trumps detail every time.

That being said, we’ve already provided customization services to several customers. If you’d like to do the same, let us know and we can make it affordable to get exactly the report you want for your business. (We also intend to increase your ability to customize the report over time.)

We’ve also shipped a variety of other improvements all over Nitrogen.

    • Reports now generate in PDF, making it easy to save any report into your CRM, or send it to your clients electronically. (This is live for some customers, and will be rolling out to all customers over the next few days.)


    • Client profiles were redesigned to make it simpler and easier to manage client portfolios.


    • We added a self-completing checklist for prospect meetings and client reviews, so you can see what’s next for each client at a glance.


Finally, we’re excited to share that we’re making some big investments in your success. We’re in the process of hiring a new team member to run Advisor Success, allowing us to deliver even more training, support and assistance to make you a more successful advisor.

We’ve also rolled out the ability to RSVP for any of our upcoming Advisor Success events right inside the product. Just click on your own name in the upper right hand corner, and click Help. Then choose the Advisor Success date you’d like to join us for, and you’ll get an email with the link to join the online event that day!

Two Improvements to our Methodology

Quantifying the risk in portfolios involves a complicated set of mathematical and methodology choices that we are always working to improve for our advisors. Today, we rolled out several adjustments to our methodology to enhance the performance of two key features — portfolio analytics and interest rate stress testing.

First, we made an adjustment to how we account for dividends in a portfolio. We now add dividends into expected return for each security after normalizing returns for the long term, to avoid the washout of dividend effects for low-beta investments.

For portfolios with high dividend-yielding funds or stocks, advisors will likely see a reduction of 2 to 4 points in the portfolio’s risk number. The largest drop we’ve seen — generally when portfolios are filled with low-beta, high-dividend investments — was 9 points on the Risk Number scale.

This is an exciting improvement that we believe will be even more accurate in showcasing the value advisors place on dividend yield in client portfolios.

Second, we made an adjustment to how we stress test portfolios for interest rate risk. We now use the last six months of returns to correlate the sensitivity of each individual security to that period’s movements in the ten year treasury rate.

Because we’re using tighter data points for interest rate stress testing, this improvement will increase the relevancy of the interest rate stress test for actively managed funds, the style drift of active managers and younger funds with less history. It will also more quickly reflect changes to Fed policy or movement in interest rates.

These two changes are a part of our constant efforts to make Nitrogen more effective for our advisors. If you have any questions about these adjustments, don’t hesitate to let us know. We love being a small part of your success!

Schedule a Demo: