

The S&P 500 Fell for a Second Straight Month. Advisors Got More Bullish Anyway.
Markets had a quiet, if slightly negative, July. The S&P 500 slipped for a second consecutive month after a strong first half, a mild pullback rather than a dramatic move. But inside the portfolios advisors were proposing to clients, things were moving.
Each month, Nitrogen analyzes more than 1,000 advisor-generated portfolio proposals per day to see how advisors are responding to changing markets. July’s data offers a look beneath the surface at where advisors were putting client money and how investors were feeling along the way.
Signal 1: Client mood
These numbers come from real conversations. Nitrogen sent an average of 769 check-ins to clients each day in July, asking how they felt about markets and their financial future.
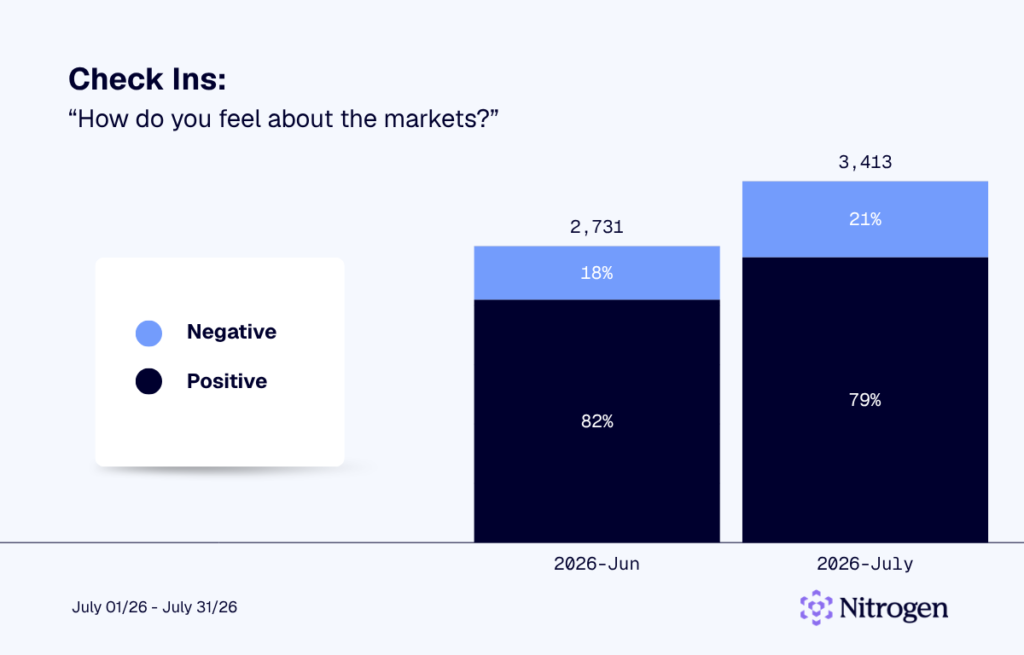
Seventy-nine percent of clients said they felt positive about the markets in July, compared with 82% in June. The three-point decline was modest, leaving nearly four out of five clients with a positive market outlook.
July Check-Ins: How Do You Feel About the Markets?
Confidence in personal finances was even steadier. Eighty-one percent of clients said they felt confident about their financial future, down just one percentage point from June.
July Check-Ins: How Are You Feeling About Your Financial Future?
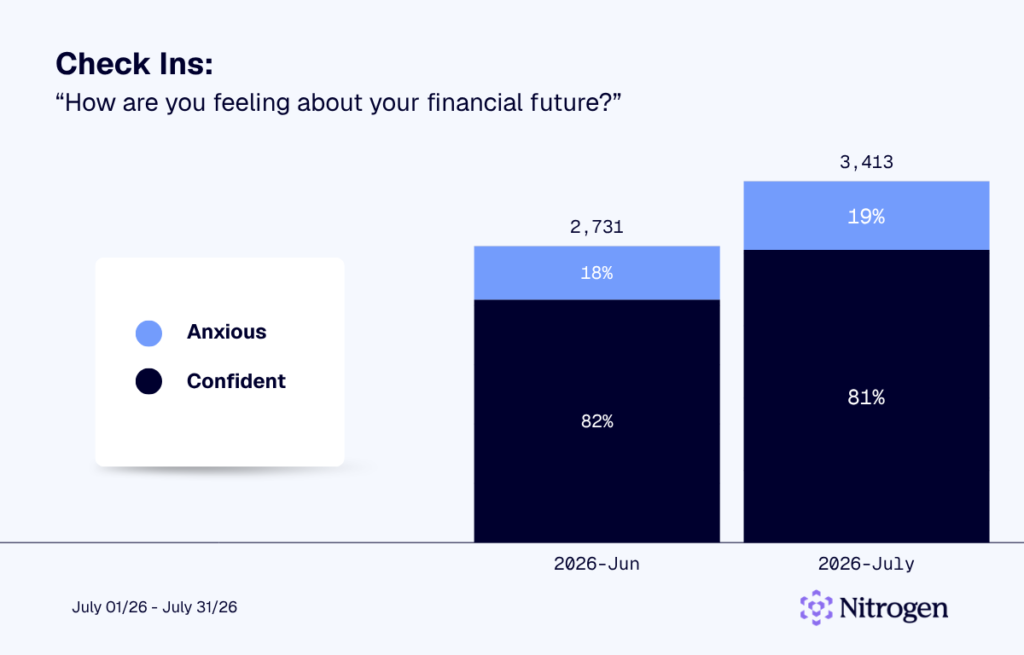
The data suggests client sentiment changed very little during a relatively quiet month for markets. Investors remained broadly positive about both the markets and their own financial outlook, continuing the stronger sentiment seen since the spring.
Signal 2: Risk posture
Advisors made a sizable move toward equities in July. Equities accounted for 51% of proposed allocations, up four percentage points from 47% in June. Fixed income held steady at 8%.
July Advisor Proposal Shifts
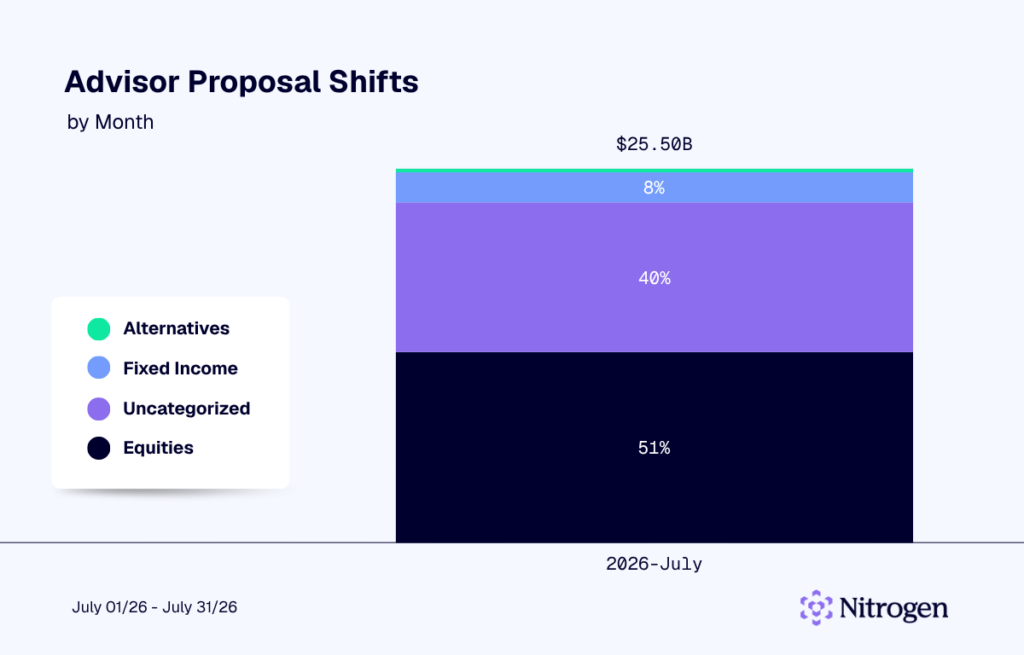
The increase points to growing confidence in equity markets among advisors. Even with the S&P 500 posting a second straight monthly decline, advisors showed a greater willingness to participate in equities.
Signal 3: Liquidity positioning
Cash and money market allocations fell to 6.4% of proposed volume in July, down from 6.7% in June. The decline marked the second consecutive month that advisors reduced their cash positioning.
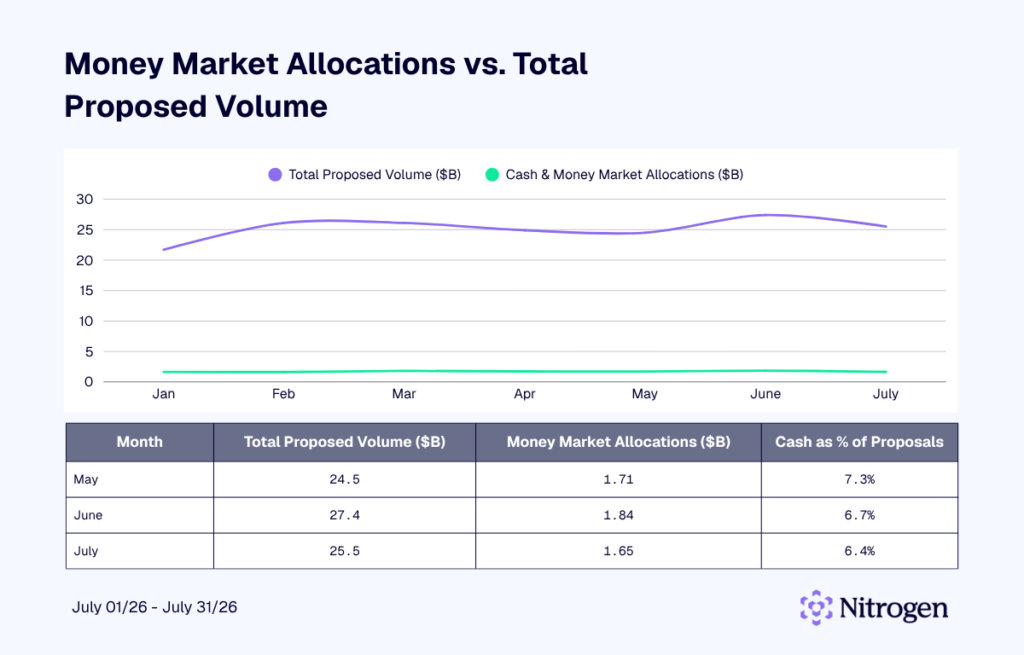
The move reinforces the bullish signal coming from equity allocations. Advisors kept less money on the sidelines while increasing their exposure to stocks. Cash remained a meaningful part of proposed portfolios, but July’s positioning showed a greater willingness to put capital to work.
Signal 4: Advisor activity
Average daily proposal volume declined to $1.21 billion in July from $1.30 billion in June. Advisors generated an average of roughly 1,080 proposals per day, also down from the previous month.
July Average Daily Proposal Volume
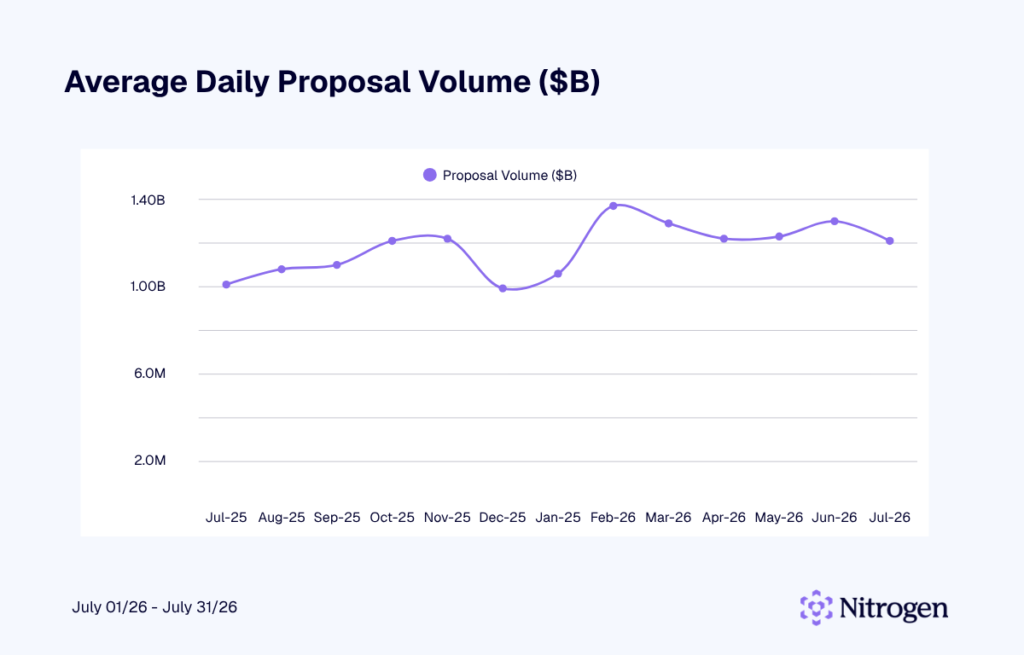
The slowdown came during the heart of summer, when vacations and lighter client calendars can naturally reduce proposal activity. July’s volume remained within the range seen over the past year, pointing to a normal seasonal slowdown rather than an unusual drop in advisor activity.
Signal 5: Concentration
July’s most frequently proposed investments looked remarkably similar to June. Nine of the top 10 products appeared in both months. The Vanguard S&P 500 ETF (VOO) climbed from ninth to second on the list, while Nvidia moved from eighth to fourth.
July Top Products Proposed
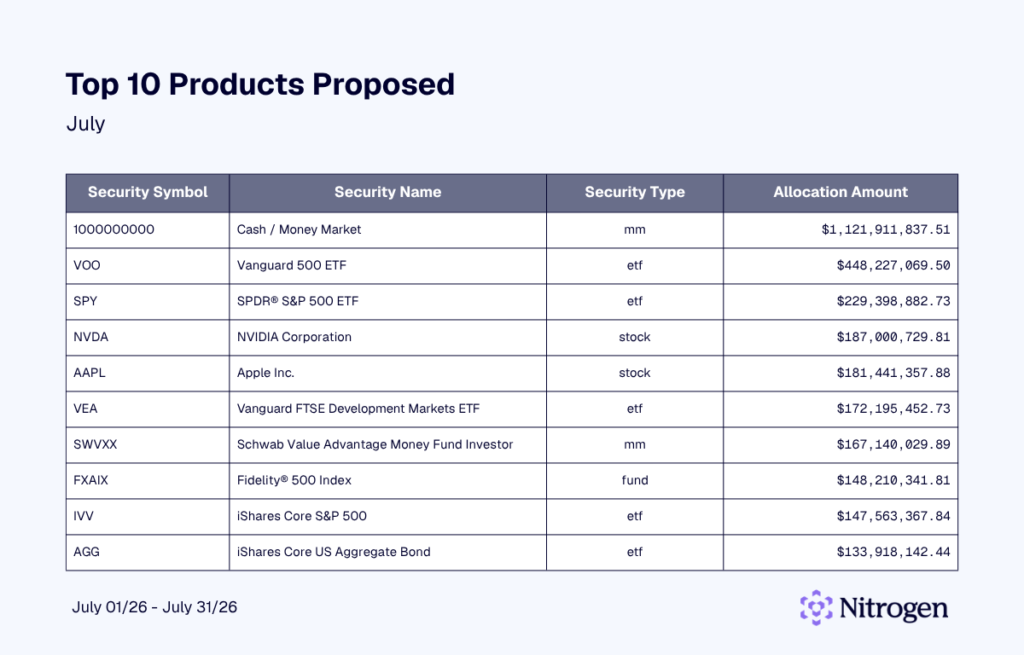
The Vanguard FTSE Developed Markets ETF (VEA) was the only new addition to the top 10, replacing iShares Russell 3000 ETF (IWV). The fund provides broad exposure to developed equity markets outside the U.S. Its appearance may reflect growing advisor interest in international diversification as opportunities outside U.S. markets attract more attention.
What a Quiet Month Can Tell Us
Big market moves tend to make portfolio decisions easier to explain. When stocks sell off sharply or surge, there’s an obvious backdrop for whatever advisors do next.
July offered fewer obvious cues.
The S&P 500’s second straight monthly decline was mild, not the kind of move that forces a portfolio conversation. Yet Nitrogen’s proposal data continued to move beneath the surface. In a month without a major market swing driving the conversation, those changes offer an interesting glimpse into where advisors were comfortable positioning client portfolios.
Sometimes the quieter months give us more room to see what advisors are thinking.
See how advisors use Nitrogen data and Risk Number® insights to guide client conversations through changing markets. Book a demo today.
About Nitrogen Signals & Shifts
Each month, Nitrogen analyzes proposal and sentiment data from across its platform to help advisors understand what’s driving client decisions. With more than 1,000 proposals created daily, these insights highlight how advisors adapt and how investors stay invested.
Thank you for reading this edition of Nitrogen Signals & Shifts. The next issue will be published in September. Subscribe at the top of this post so you never miss an update.