It all starts with Nitrogen's proprietary analytics.
The Risk Number
Every position has inherent risk. With the power of The Risk Number®, you can quantitatively measure the true risk of a security, account, or portfolio and use that information to drive smarter long term investment decisions. Read More >
95% Historical Range™
There’s 5% of the risk nobody can quantify, but your job as their advisor is to control the 95% that you can. The 95% Historical Range illustrates the “normal” behavior for your client’s portfolio, helping you keep your clients from making fear-bound decisions that blow up long term goals. Read More >
GPA®
Always understand the relationship between expected performance and potential downside so your clients know their holdings are working in the most efficient manner. With a single number, the GPA demonstrates risk/reward efficiency while considering dividends and expenses ratios. Read More >
Unleash your inner math geek with Detailed Portfolio Stats.
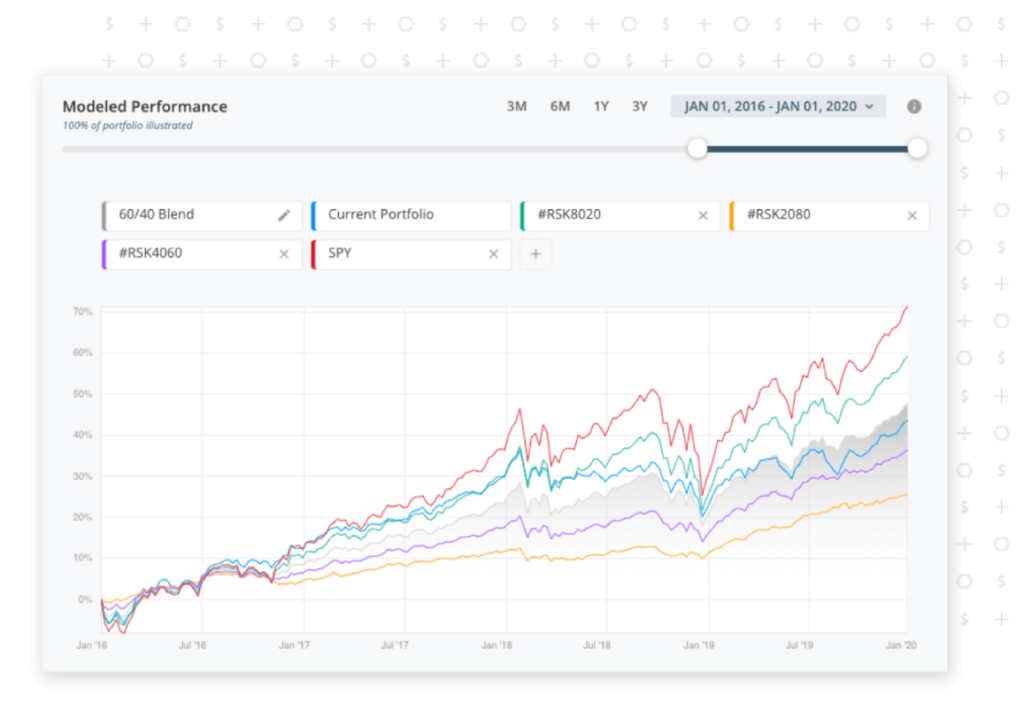
Check out interactive historical and statistical data related to your portfolio. Compare with just about anything – market indexes, models, blended benchmarks, and individual securities.
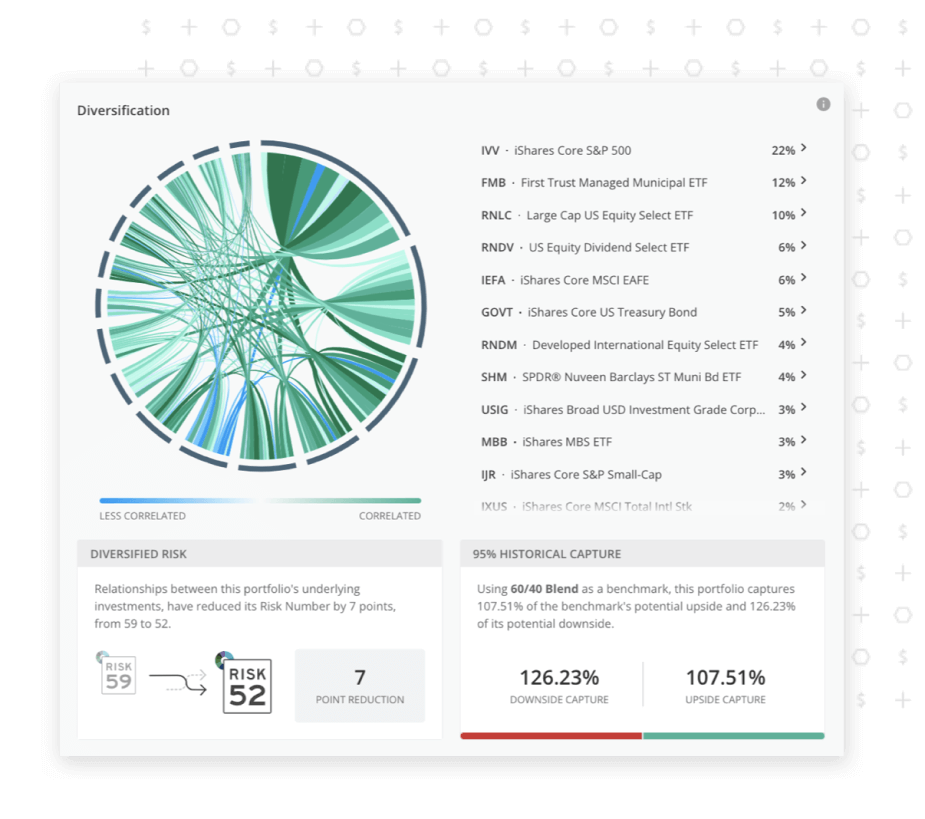
Need to check on the diversification of a particular fund or account? Now you can with Correlation, Diversified Risk, and 95% Historical Capture widgets.
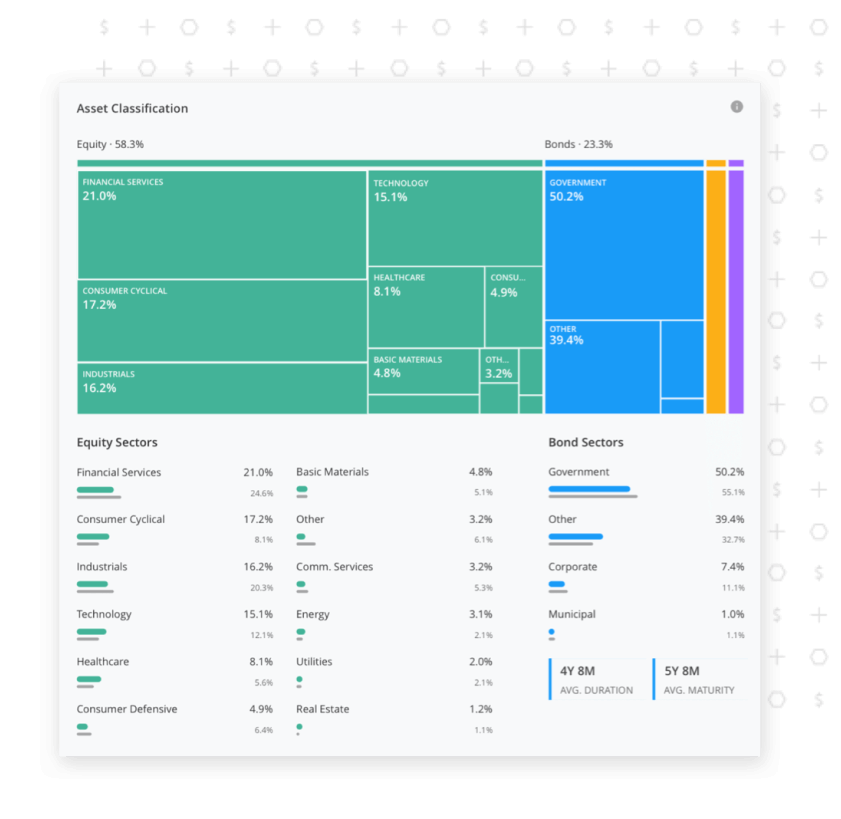
Take a close look into a portfolio’s exposure to equity and bond sectors. You can feel confident knowing what’s under the hood of your client’s investments.
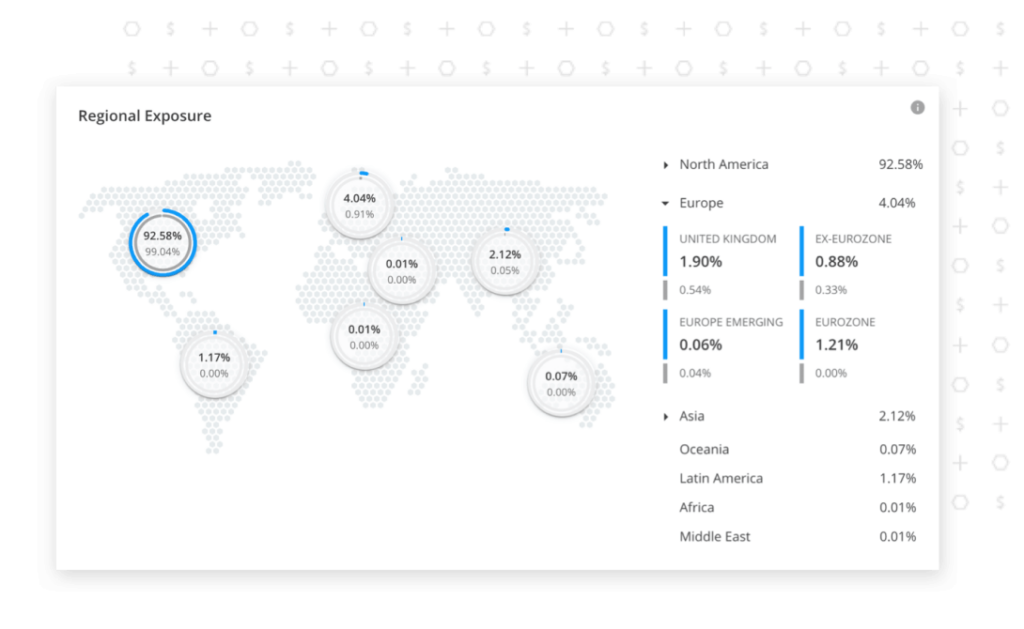
Heavily weighted in domestic funds or emerging markets? Explore a fund’s regional exposure with just a single click.

The Risk and Reward scatterplot paints the picture of risk efficiency by comparing your portfolio to common benchmarks and indexes. Shift between multiple time frames and delve into the top 10 portfolio holdings.
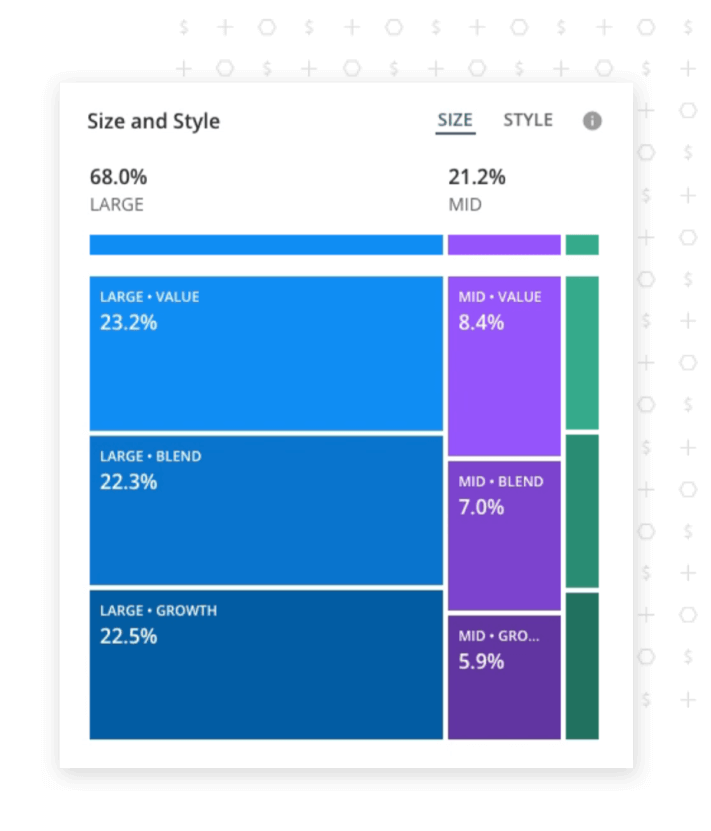
Visualize your data from both sides. Toggle between “size” and “style” to see the breakdown between small, mid, and large cap or value, blend, and growth funds within a portfolio.
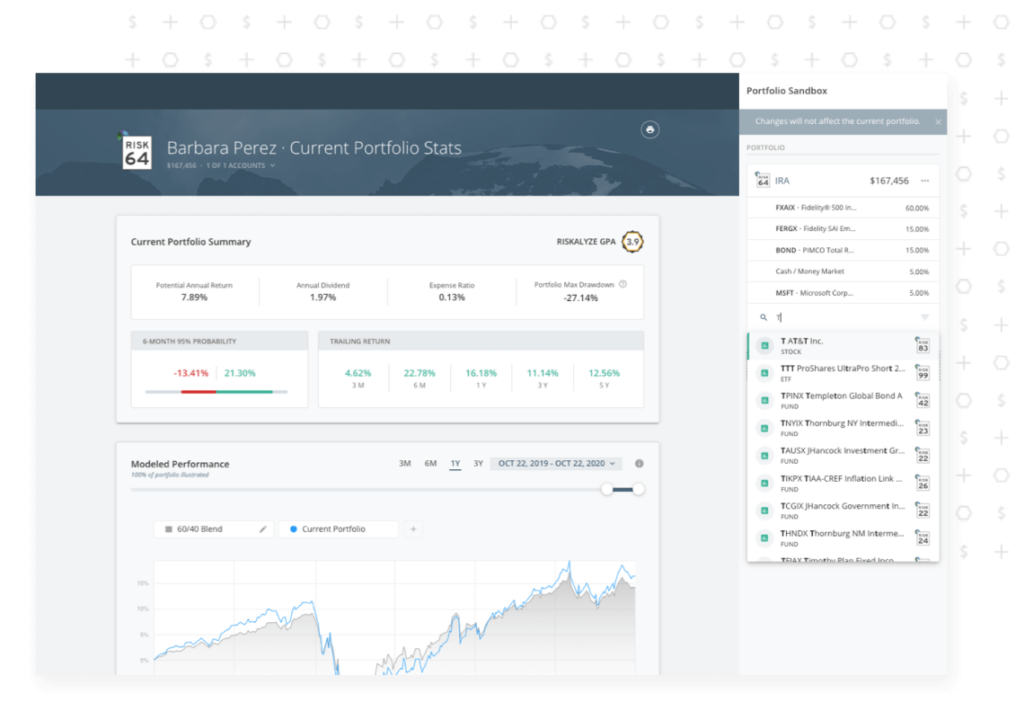
Ever wish you could make changes to a client’s portfolio and immediately see the impact? From minor tweaks to major alterations, Sandbox gives you the ability to test potential changes in a portfolio and immediately see the impact before implementing.
Illustrate your expertise with clients.
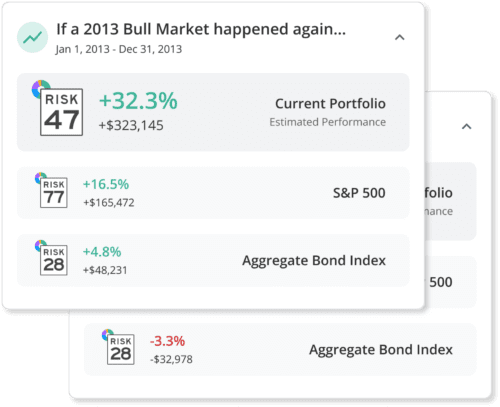
Stress Tests
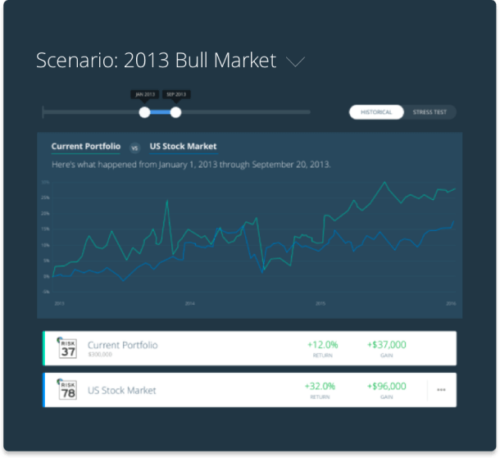
Want to determine how a portfolio would have reacted during the Financial Crisis or the 2013 Bear Market? Stress testing allows you to simulate these events proving your client’s portfolio is in alignment with their goals. Learn More >
Scenarios
Elevate your stress testing and create a portfolio narrative through custom scenarios. Shift between stock and bond market depictions and compare them to benchmarks to ensure your clients can handle every situation. Learn More >
“Now that I have Nitrogen, I’ve been able to consolidate my tech spend. This analytics solution has everything I need and more.”
– ROBERT, ADVISOR IN OHIO
Meet Discovery:
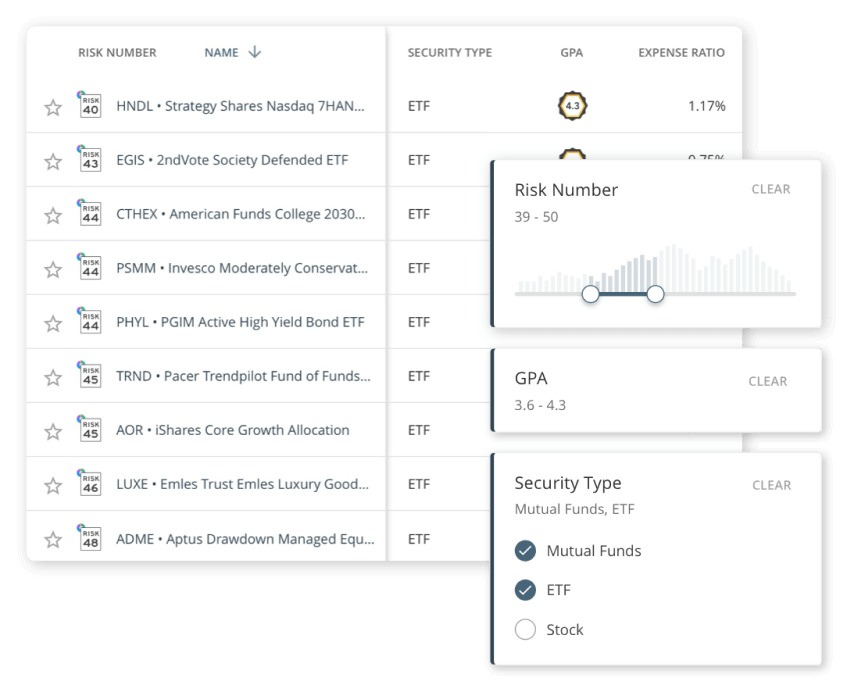
Your new favorite way to search and find the right securities.
Conduct all of your research and investment analytics inside Nitrogen without switching browser tabs. With Discovery, you can harness the proprietary power of the Risk Number®, GPA®, and more to search for the perfect investment for every client.

Individual Security Analysis done right.
Risk analysis at the security level: Nitrogen runs daily analysis at the individual security level, covering over a quarter million stocks, ETFs, mutual funds, SMA third party money managers, individual corporate, government, and municipal bonds, non-traded alternatives, annuities, REITs, and more!
Next-level research at your fingertips: Want to drill deeper into individual security analytics? It’s easy to pull up a rich set of data for stocks, ETFs, and mutual funds. Whether you want to model performance, see trailing returns, dive into asset classification, or see regional exposure, Nitrogen has you covered.
Request a DemoSyncing in assets has never been easier.
Custodial Integrations
We integrate with all the major custodians, so you can rest easy knowing data imports easily, accurately, and stays up-to-date.
Outside Asset Sync
Investors can securely enter credentials remotely or by your side to sync in outside holdings from over 18,000 institutions.
Import Files
Templates allow you to drag and drop files into Nitrogen for automatic conversion into portfolio analytics.
Build Your Own
Adding holdings into Nitrogen is as simple as typing a ticker followed by a cash value or allocation percentage.
Demonstrate your expertise with compelling reports.
Generate a beautiful report, attach anything you’d like, and deliver as PDF or paper.
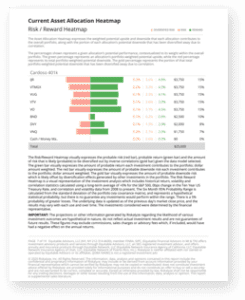
Put risk alignment on paper. Propose the right amount of risk and give investors what they need in order to understand it.
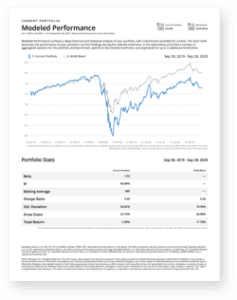
Clients want to understand their investments and the data behind them. Communicate your plan by showing detailed reports with intuitive visuals that bring their portfolio to life.
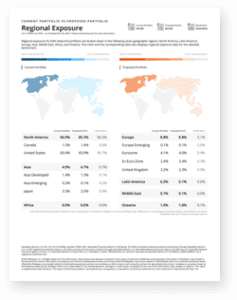
Compare portfolios side-by-side and prove you have your client’s best interest in mind. The Stats Comparison Report marries unparalleled analysis with beautiful charts and visuals.
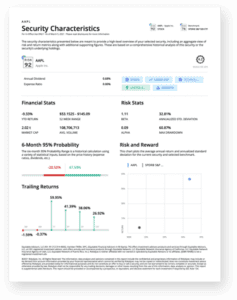
Dive deep into the financial stats, trailing returns, modeled performance, and risk and reward of any individual stock, mutual fund, or ETF, and download or print with just a few taps.
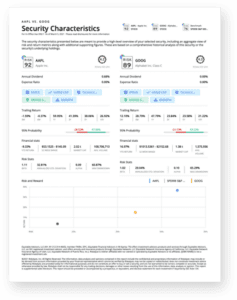
Easily compare two securities with a wide variety of beautiful visuals and metrics. The Security Comparison Report empowers you to build better portfolios by picking the best investments for your clients.