We pride ourselves in our respect for the markets. We believe that price is truth and that you need to approach investment analysis with humility or you risk being humbled by the complexity of the markets.
Our Risk Number’s corresponding six-month, 95% Historical Range is a historical calculation using a variety of statistical inputs, based on the price history (expense ratios, dividends, etc.) at the holding level. This bears repeating; we do not use the antique process of mapping holdings to a set of assumptions at an asset allocation level. Price, at the holding level, is truth. We derive our statistics from each holding’s actual price history because it is more robust than an asset allocation mapping methodology.
Even though our six-month, 95% Historical Range is a historical calculation that doesn’t explicitly say “here’s what is predicted to happen in the next six months,” we assume that humans may implicitly apply historical probabilities into the future. Even though we can all recite the phrase “Past Performance Is No Guarantee of Future Results,” we test our methodologies to inform best practices for those who implicitly use the past as an input for what to expect in the future.
Recently (Fall 2016), we tasked our incredible team of engineers with a project that first required them to identify portfolios that broke below Nitrogen’s six-month, 95% Historical Range in the six months following the calculation. This was a thought exercise to inform best practices and potentially uncover areas for improvement in our methodology.
Random samples failed to produce significant examples of portfolios breaking below the historical range in the six months following historical calculation. In a search for rogue securities and portfolios, we decided to put our methodology through the proverbial ringer by hand-picking a myriad of difficult six-month epochs from the past couple of years. We hand-selected a variety of ranges where the markets jolted downward and were very pleased with the results.
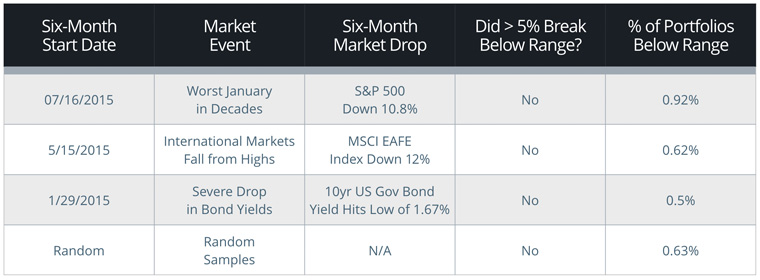
We define a “portfolio” as an account or set of multiple accounts that contain at least two securities. We analyzed over 100,000 unique portfolios (see “Random Samples” above) and saw an average of 0.63% break below the projected six-month, 95% Historical Range; well within expectations.
This data set is focused primarily on 2014-Nov 2016 when markets overall (except in instances like those cited above) have been in a relatively low volatility state.
The six-month, 95% Historical Range is profound because humans make decisions in the short term. Great advisors couple the realities of short-term investor psychology with a discussion of long-term risk capacity (powered by Retirement Maps) to empower their clients to invest fearlessly for the long haul.