By: Mike McDaniel
Co-Founder & CIO, Nitrogen
The Risk Number® and its methodology have transformed how advisors tackle risk in client conversations, and advisors not known for lavish compliments continue to see great success because they are getting risk right.
Get risk right, and clients come aboard because they get it. It makes sense—and it’s so simple to understand because you’re the advisor showing them the quantitative truth, not throwing around subjective words like “conservative” or “moderate.” Get risk right, and clients trust your advice implicitly.
They ignore normal market volatility or that “hot tip” from their buddy, because they have the right expectations and alignment.
Get risk right, and proving that you’re always acting in a client’s best interest becomes simple—it’s easy to demonstrate how your firm weaves together portfolio risk with risk tolerance, risk capacity and the long-term plan.
With the Nitrogen process, you have an end-to-end approach that documents the client’s preferences, their risk capacity, their track record as an investor, and how all of that informed and justified your recommendations. The only way to get best interests right is to get risk right.
But it isn’t easy to get risk right. It takes bulletproof methodology infused into the foundation from the start.
Firms that complete thorough due diligence on the math and methodology behind the technology they invest in—they choose Nitrogen. And there are four clear reasons for their decision.
Why Choosy Advisors Choose Nitrogen
Reason #1: Price is Truth
First, we believe that “price is truth.” The worst abuses in financial advice come when we try to replace what the markets actually did with subjective assumptions and guesswork.
We should minimize those, and stick to the truth of what the markets actually did with investments.
Because price is truth, that requires us to recalculate the Risk Number and all our analytics at the security level every single night. We reject the lazy competing approach that almost everyone else takes—mapping every security to an asset allocation, and assuming those securities will march in lock-step together.
History tells us that’s not true—and that’s why it’s not possible to truly document best interests if you’re doing risk at the asset allocation level. Because we’ve built all this sophistication under a simple and easy-to-use product, many advisors don’t even fully understand the sophistication of what they’re using every day.
We can deliver sophisticated technology because we’re committed to doing risk right. We have a risk and methodology team dedicated to developing and refining our calculations in a way that nobody else even attempts.
Reason Two: Data Selection is Critical
Now, the second way we attack this problem differently is that we believe data selection is critical.
Anytime you look at analytics, you need to know what data goes into calculating them. We just looked at asset class vs. security level data, but what about timeframe?
Everyone else uses arbitrary 1, 3, 5 or 10 year look-back periods. And guess what that conveniently leaves out? 2008!
Nitrogen purposefully uses a data set that includes 2008, because if you remember: volatility spiked tremendously, and all correlations went to 1.
We’ve seen it time and time again in evaluating the quality of our analytics—using the right data and ensuring that good, bad, and sideways markets are included will set you and your clients up for success instead of disappointment.
Reason Three: We Don’t Predict the Future
Third, competing approaches claim they can tell you how a portfolio will perform in the future—just so long as someone is right about the 10 different assumptions that go into the calculation.
If that sounds crazy, it’s because it is. A lot of the products out there claim to “crash test” portfolios effectively, but they will make you guess what will happen to:
- Inflation
- Currency
- The stock market
- Interest rates
- Oil prices
- Commodity prices
- The impact of certain news events
That’s a lot of guesswork. But hey, if you pull all those levers in just the right way, some of the analysis might be correct.
Then again, maybe not. We came across one of these “crash tests” that played out in real life.
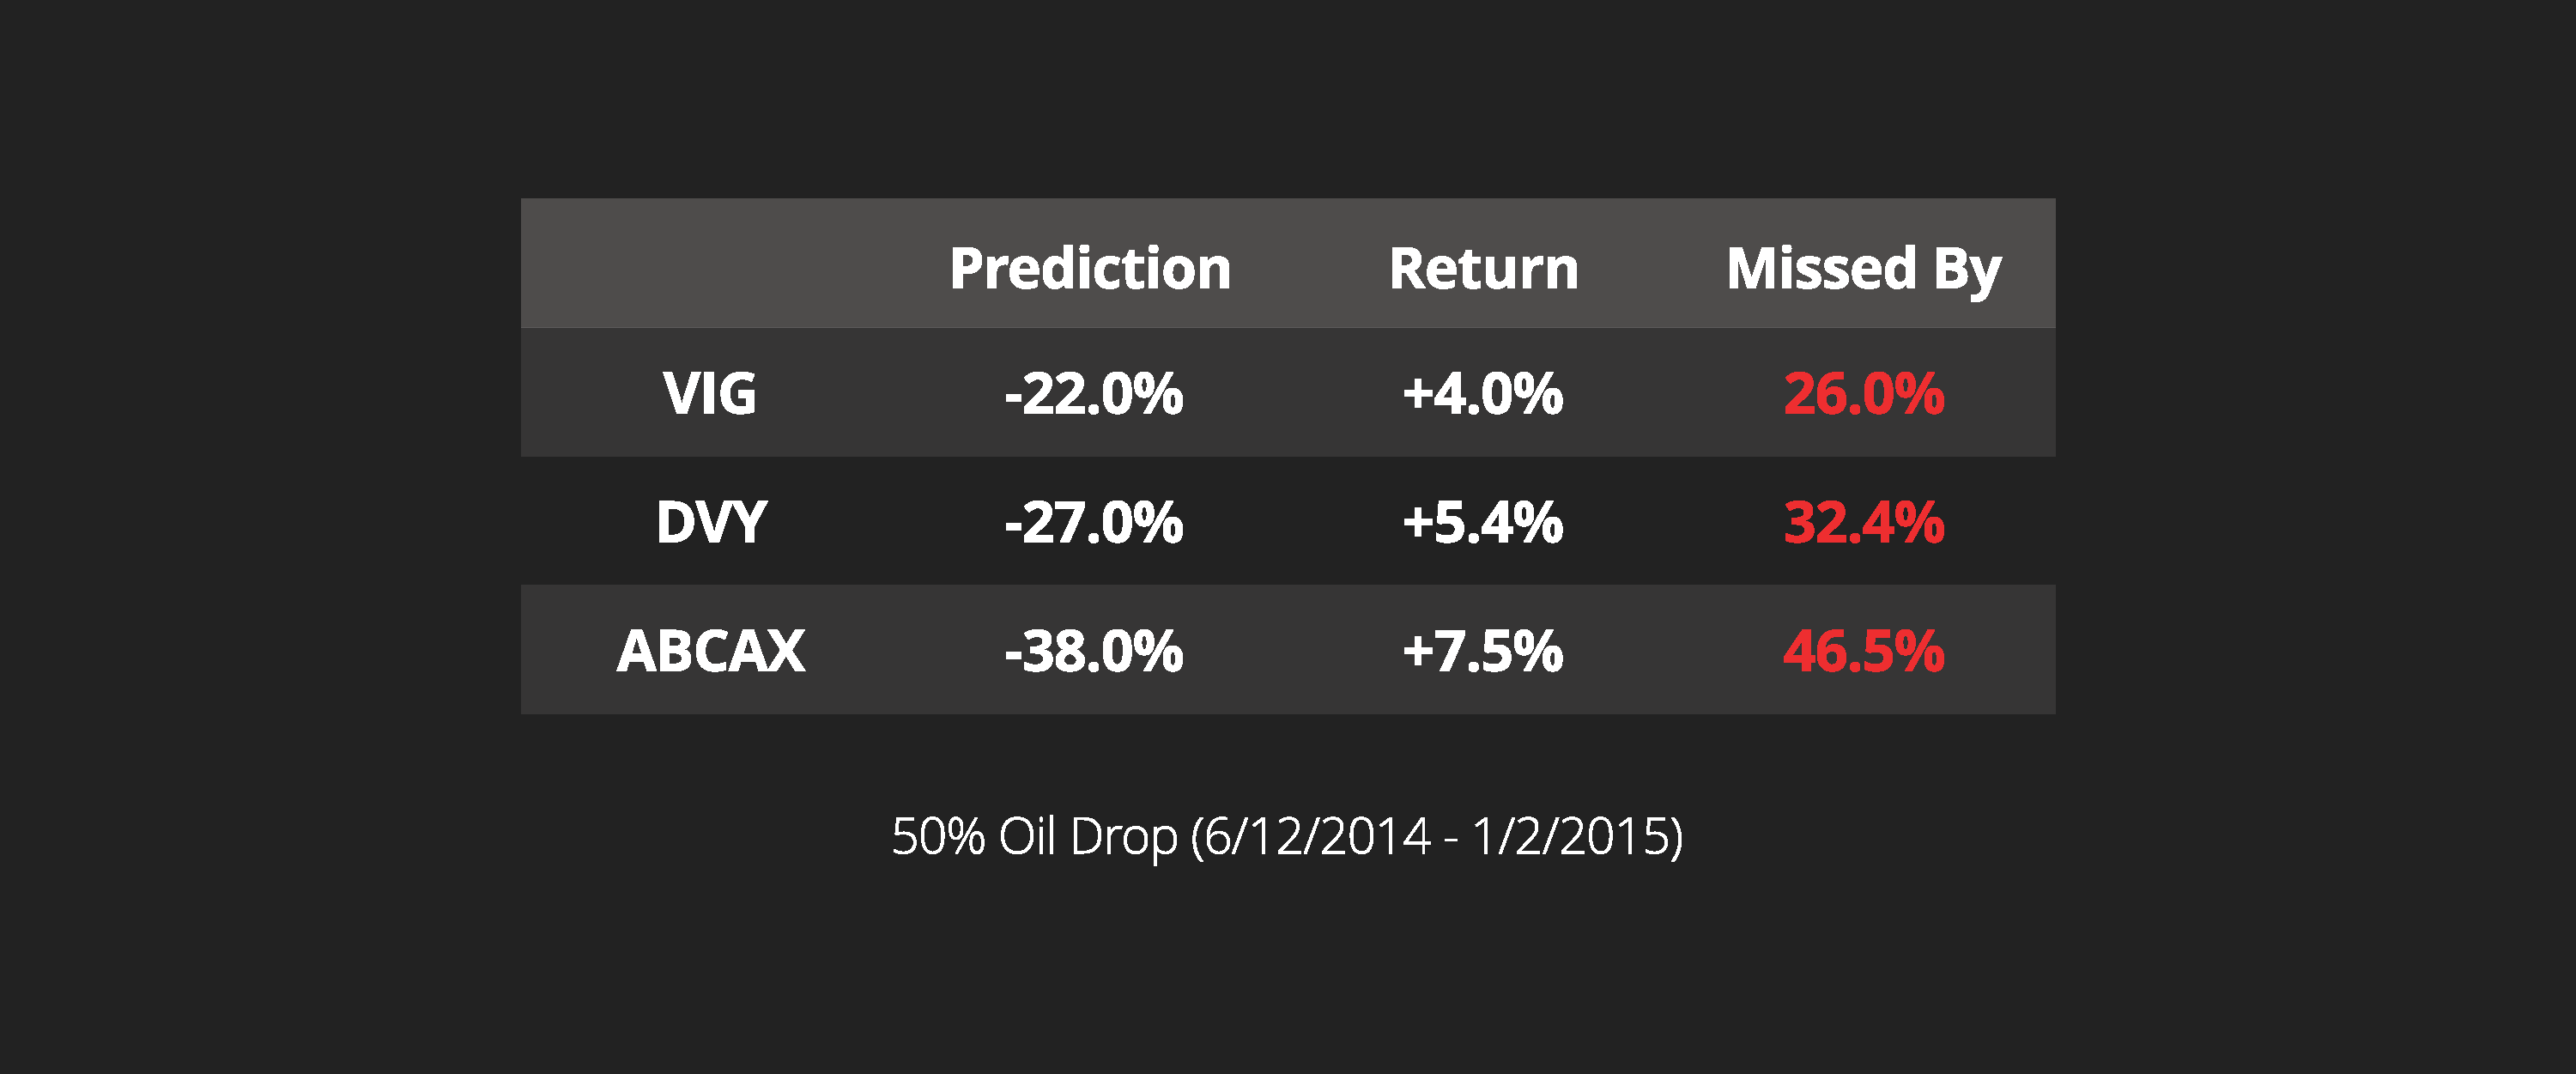
The tool in question assumed oil would drop 50% and projected that three different funds would therefore be down between 22% and 38%.
Then oil actually did drop 50% and all three funds went up.

Can you believe that? If you had been lucky enough to guess the price of oil correctly, this tool still would have gotten it completely wrong, all because of bad methodology.
Now imagine having to correctly guess on ten different factors!
Reason Four: We’re With Math
Finally, competing approaches don’t have a quantitative way to calculate an investor’s appetite for risk.
Instead, they lean on arbitrary, outdated stereotypes based on the investor’s age, time horizon, and market sentiment. Nitrogen uses an academically-validated objective approach, built on top of a Nobel Prize-winning framework, and leveraging the real dollar amounts that your clients can relate to.
There are a small cohort of Guesswork Advisors out there, primarily those who don’t want their clients to understand the true risk in their portfolios, who attack the science of our approach and claim, quote, “it’s impossible to get any true measurement of a client’s risk tolerance.”
Well, let’s be clear. That handful of advisors have chosen guesswork over math.
As for me? I’m with Math. And I’m proud to serve advisors who also believe in math!
You’re the type of advisors willing to bet on getting risk right. The advisors who think deeply about how data selection can skew analytics. The advisors who reject assumptions and guesswork and choose math instead.
Guesswork has no place in financial advice. Take a tour of Nitrogen to see how our math provides the foundation for life-changing conversations.
