
Go to the source
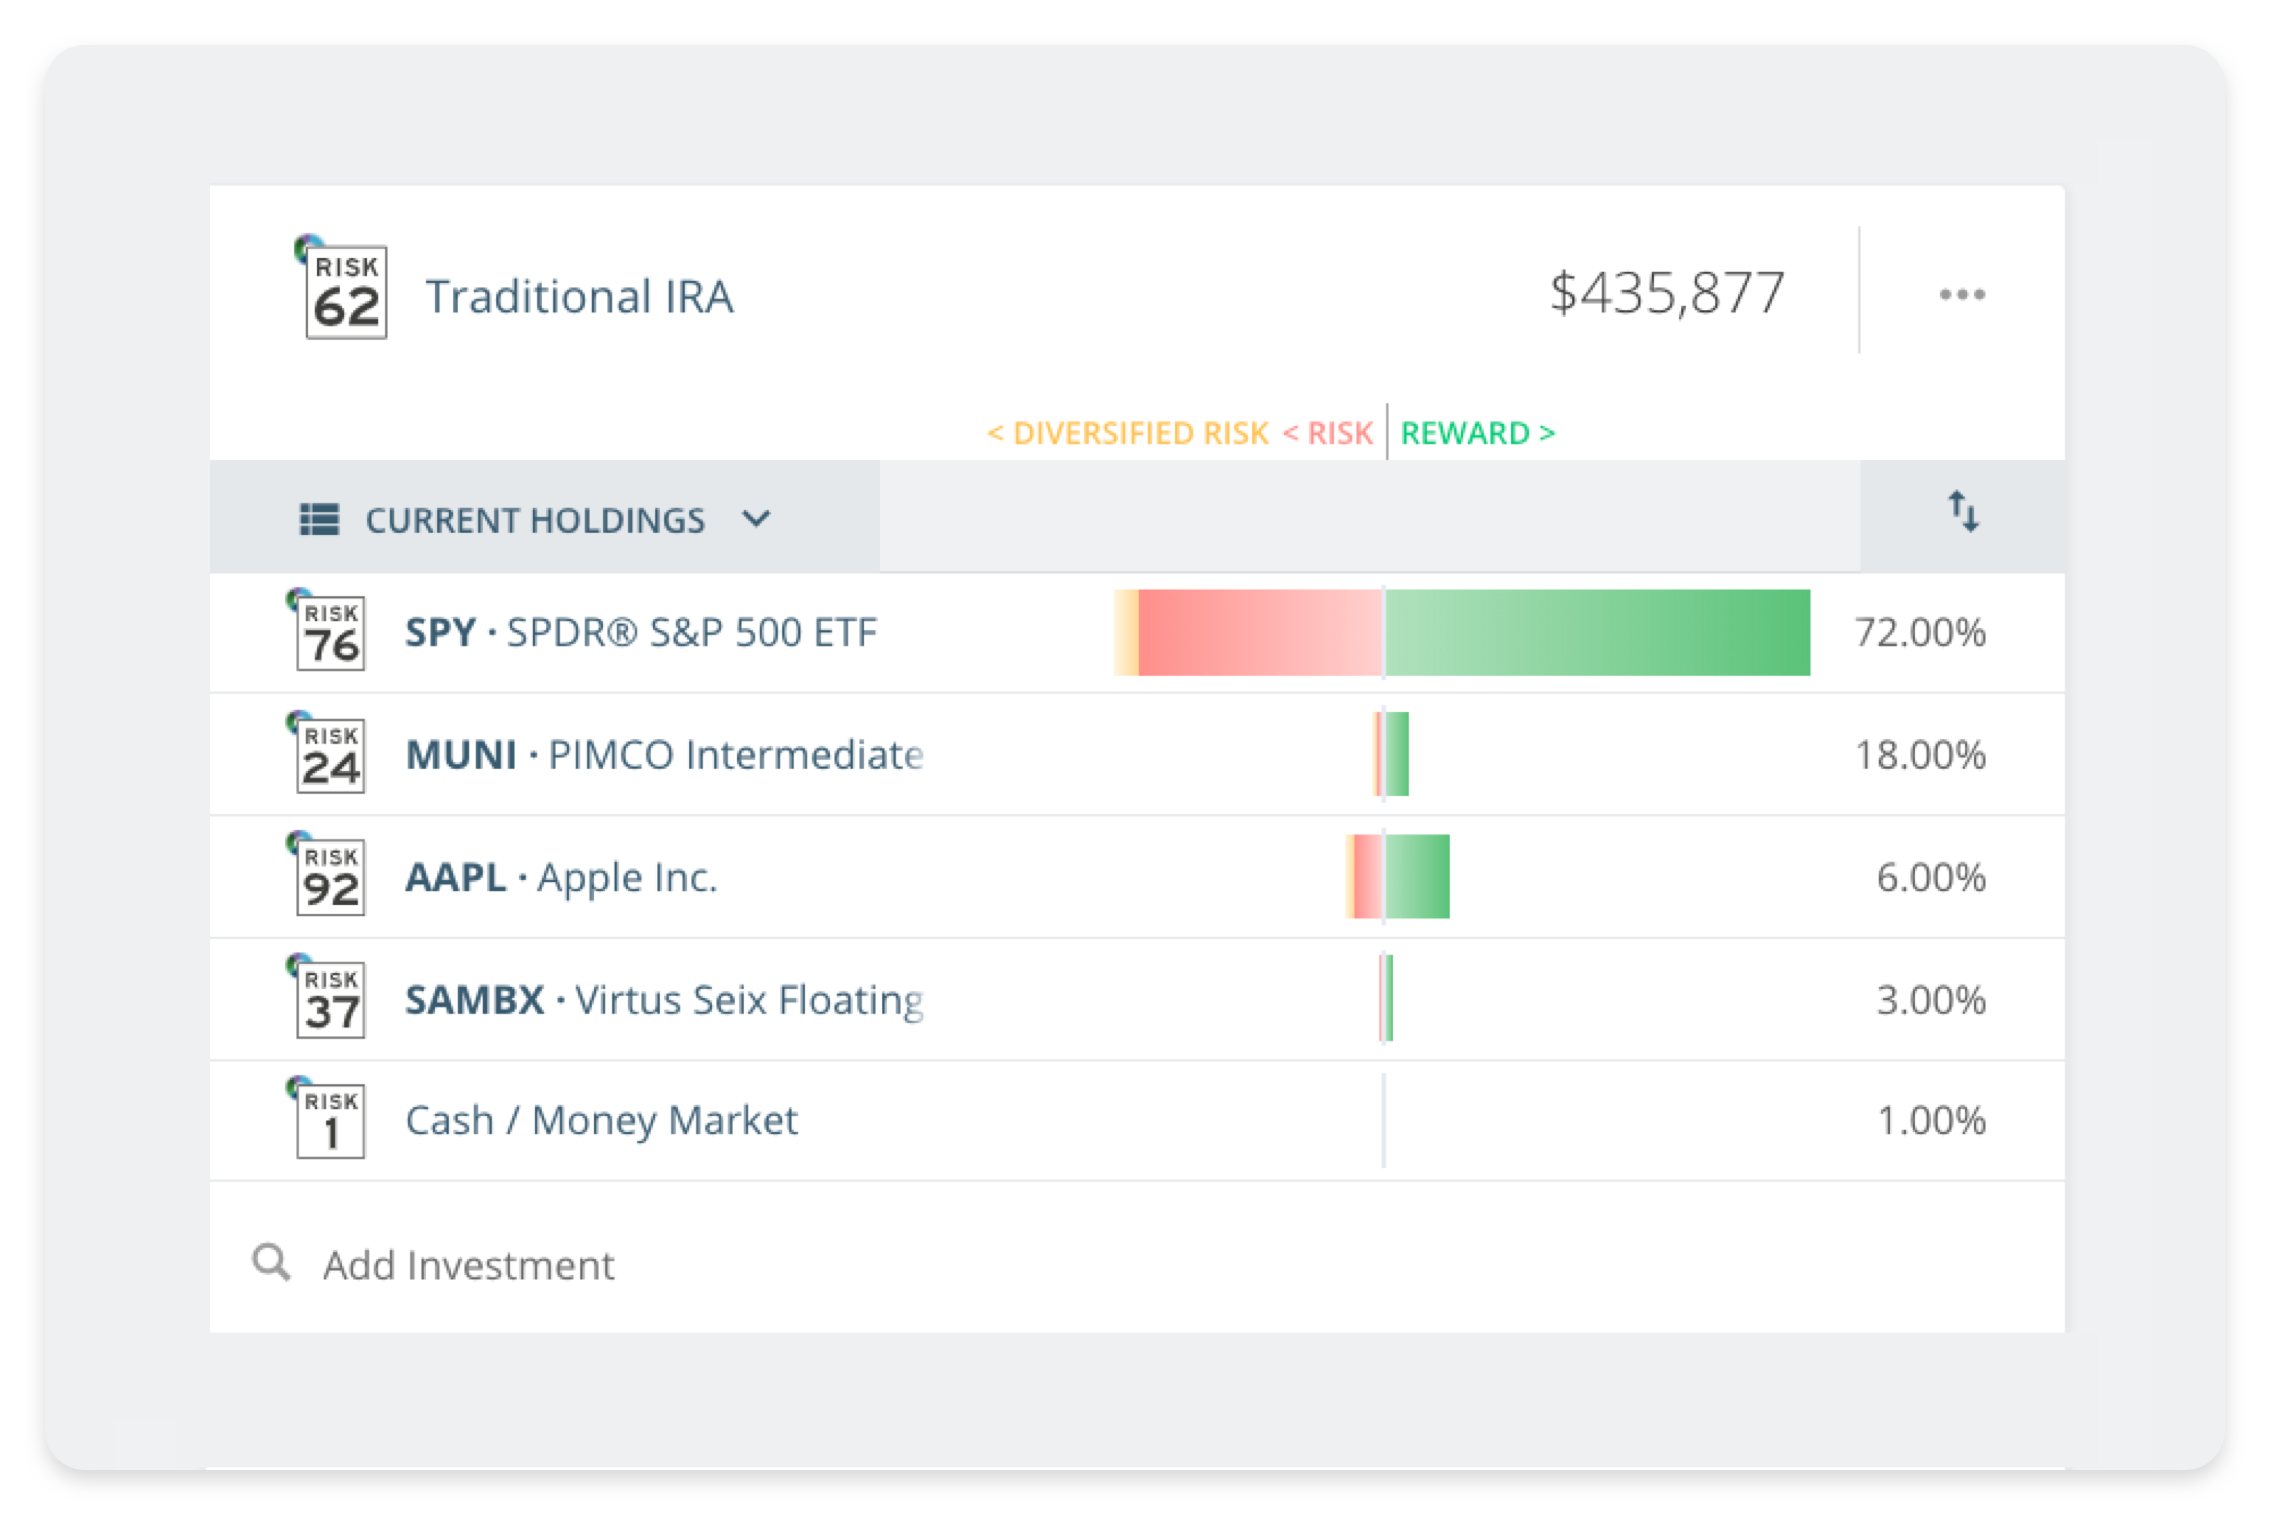
See the impact a sentimental stock or concentrated position has on a client’s portfolio. Risk is plotted on the heatmap in proportion to allocation, allowing you to show your clients an intuitive illustration about why you’ve made certain decisions together.
With one quick visual, you can see the performance, volatility, and correlation of each individual security within the content of your client’s total portfolio.
Visualize diversified risk
Every tool at your disposal.
It’s never been easier to set expectations with clients, prove your fiduciary care, and grow your business.

Run a portfolio through a market timeline and compare it to just the right benchmark to make your point.

Run portfolios through historical events like the 2008 Financial Crisis or 2013 Bull Market to help clients understand what it means to control risk or beat the market.

Does an investor's risk tolerance align with how they're invested? A portfolio-wide Risk Number® and 95% Historical Range™ enable you to make investment decisions and demonstrate alignment to your prospects and clients.

Want to leverage the Risk Number® for your brand? We've got an interactive portal of design templates and other resources available in your Nitrogen Elite account.

Check-in emails build a strong foundation to support your message between client reviews and give you an early warning signal when client psychology needs care.

Unleash your inner math geek with in-depth analysis of everything from modeled performance comparisons, sector breakdowns, regional exposure, and more!

Find the perfect investment for your clients with security analysis and fund screening. Discovery empowers you to quickly dive into your investment research based on your most important search criteria including the Risk Number®, GPA®, expense ratios, and more.

Drop a simple link onto your website or email signature to turn it into an interactive risk analysis tool and a lead capturing machine. Now you can leverage the four most powerful words in financial advice, "What's Your Risk Number?"

Effortlessly launch a remote meeting with just two clicks. Your client joins with a web browser, and you’re protected from sharing the wrong data with the wrong client.

Seamlessly import outside assets from thousands of institutions. With client credentials entered remotely or by your side, manual updates become a thing of the past.

Take advantage of our collection of free and subscription-based models and download them into your Nitrogen account. Stay up to date on the industry's best strategies!

Don't wonder if a client's risk preference will allow them to achieve their goals—calculate their probability and build a map to success. Illustrate the bigger picture and even uncover outside assets.

Finally, it's easy for you to use the Risk Number® to match hundreds or thousands of 401K, 457, 403B, or Simple IRA plan participants with just a few clicks. The Risk Number creates a common language, allowing you to bridge the gap between advisor and participants without flooding your to-do list.

A customizable report builder that lets firms control content and compliance while enabling advisors to deliver personalized, client-specific reports.

Meet the objective metric that has paved the way to measuring the efficiency of investments not just at the fund level, but at the portfolio level as well.

Eliminate the stereotypes that have made risk tolerance useless. Use leading scientific theory to objectively pinpoint an investor's Risk Number®, whether you’re across the room or across the world.

Unlock the power of events in Retirement Maps. See how changing your client's Risk Number®, income, or expenses over time will affect their overall risk capacity.