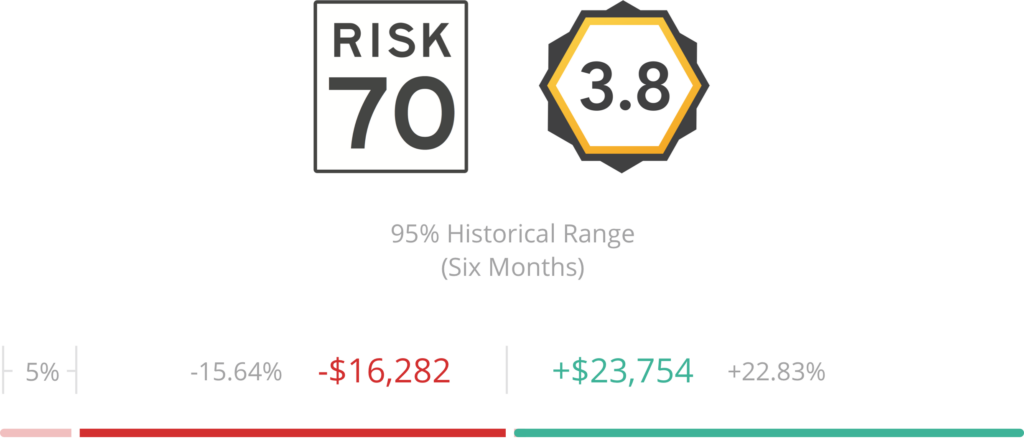
Illustrate normal portfolio behavior
The 95% Historical Range illustrates the risk in your client’s portfolio, representing the potential gains or losses it may experience over a six-month period.
Although there’s 5% we can never quantify, investors make better decisions when they understand what is “normal” for their portfolio. Great advisors use Nitrogen to set expectations and illustrate the relationship between risk and return.
When clients understand their 95% Historical Range, it gives them permission to ‘hang in there,’ even when markets are volatile.

Understand the risk of each holding
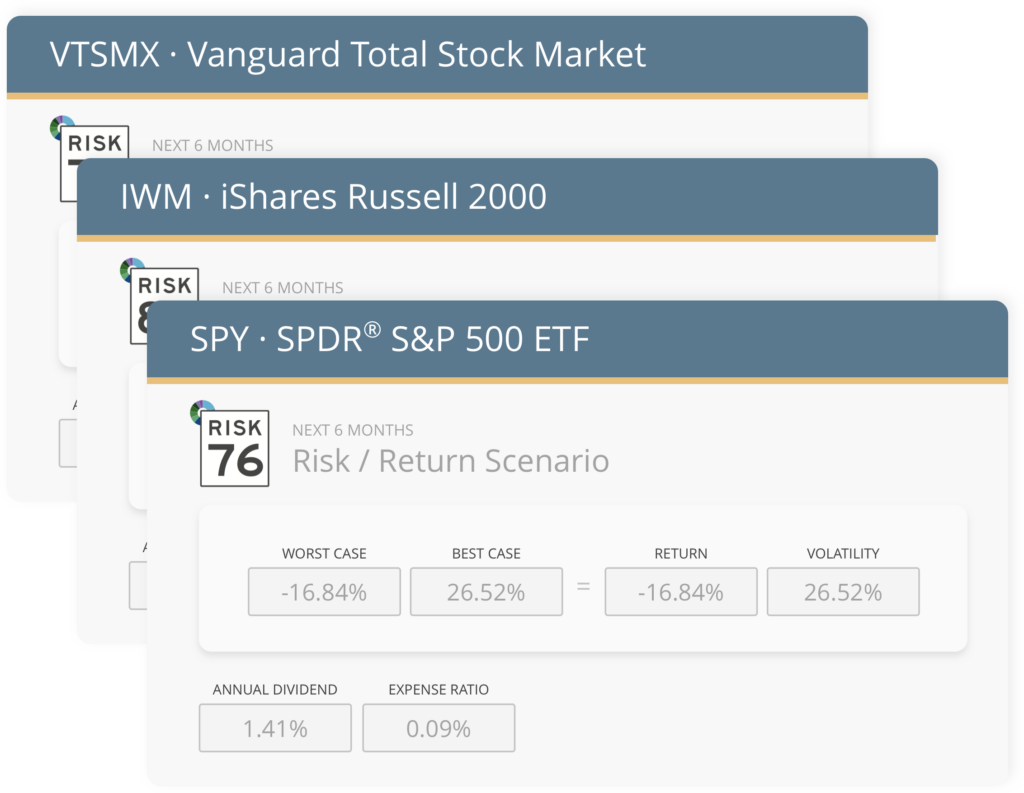
Analyze the risk of over a quarter-million securities, products, and strategies to see how accounts roll up into a portfolio-wide Risk Number.
Nitrogen runs daily analysis at the individual security level, meaning we don’t lump funds or stocks into asset classes and make broad assumptions. Whether you use stocks, ETFs, mutual funds, bonds, REITs, or annuities, every security has an individual Risk Number.
Whether you’re optimizing a client’s current portfolio, proposing a brand new one, or comparing portfolios side-by-side, Nitrogen’s analytics have you covered.
Every tool at your disposal.
It’s never been easier to set expectations with clients, prove your fiduciary care, and grow your business.