
Detailed portfolio analysis through the lens of risk
The beauty of the Risk Number® is how it empowers investors to stay the course during the short term so they don’t lose sight of the long term. But what happens when your analytical clients need more detailed analysis or reporting?
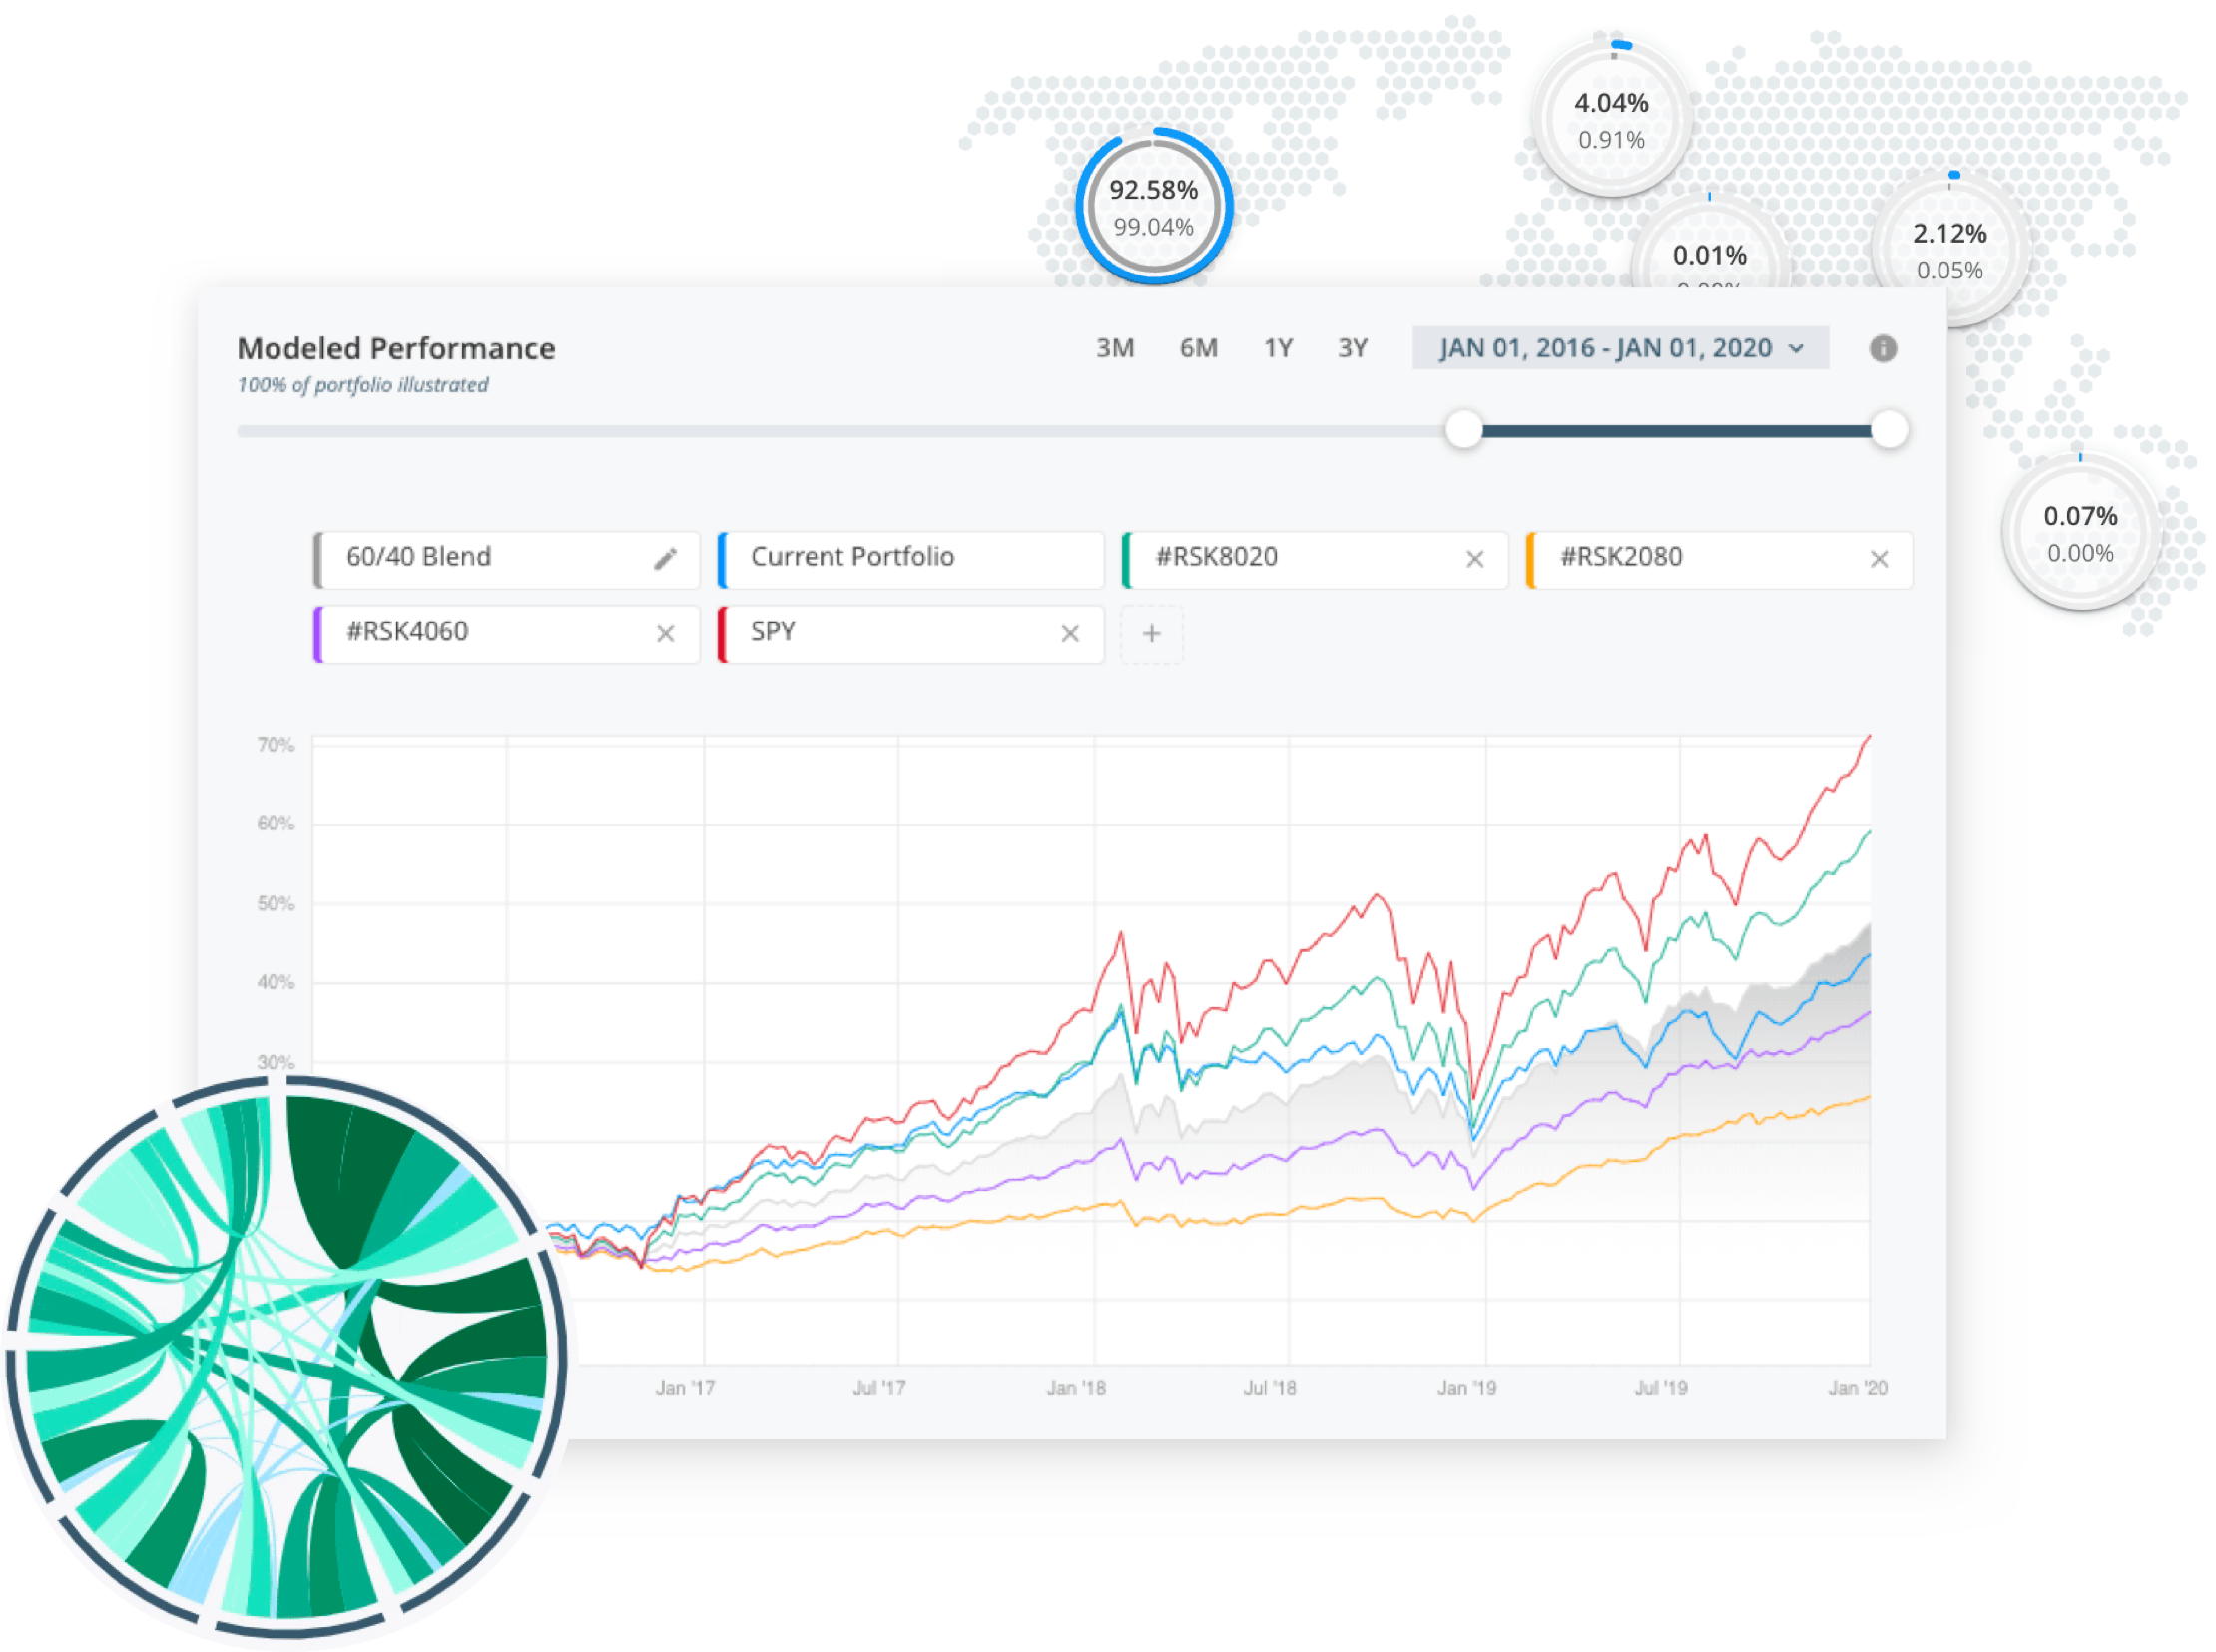
Detailed Portfolio Stats is data analytics taken to the next level. With a variety of tools ranging from modeled performance, sector breakdowns, risk/reward scatter plots, and data correlation, it’s the most effective way to analyze a portfolio through the lens of risk.
Better data, better decisions
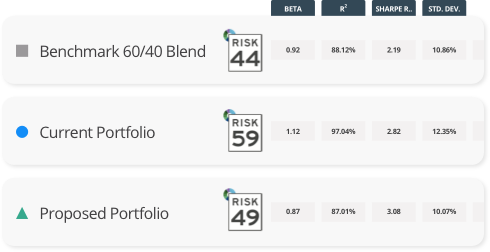
Powerful portfolio analytics help you analyze the data that matters so you can make informed decisions. From Sharpe Ratios, Beta, Drawdown, and everything in-between, Stats has you covered (TI-83 calculator not required).
Want to test a different mutual fund or ETF in a client portfolio? No problem — with Portfolio Sandbox, you can easily swap stocks or funds to test potential changes to client portfolios and immediately see the impact before implementing.
Compare everything. Clearly.
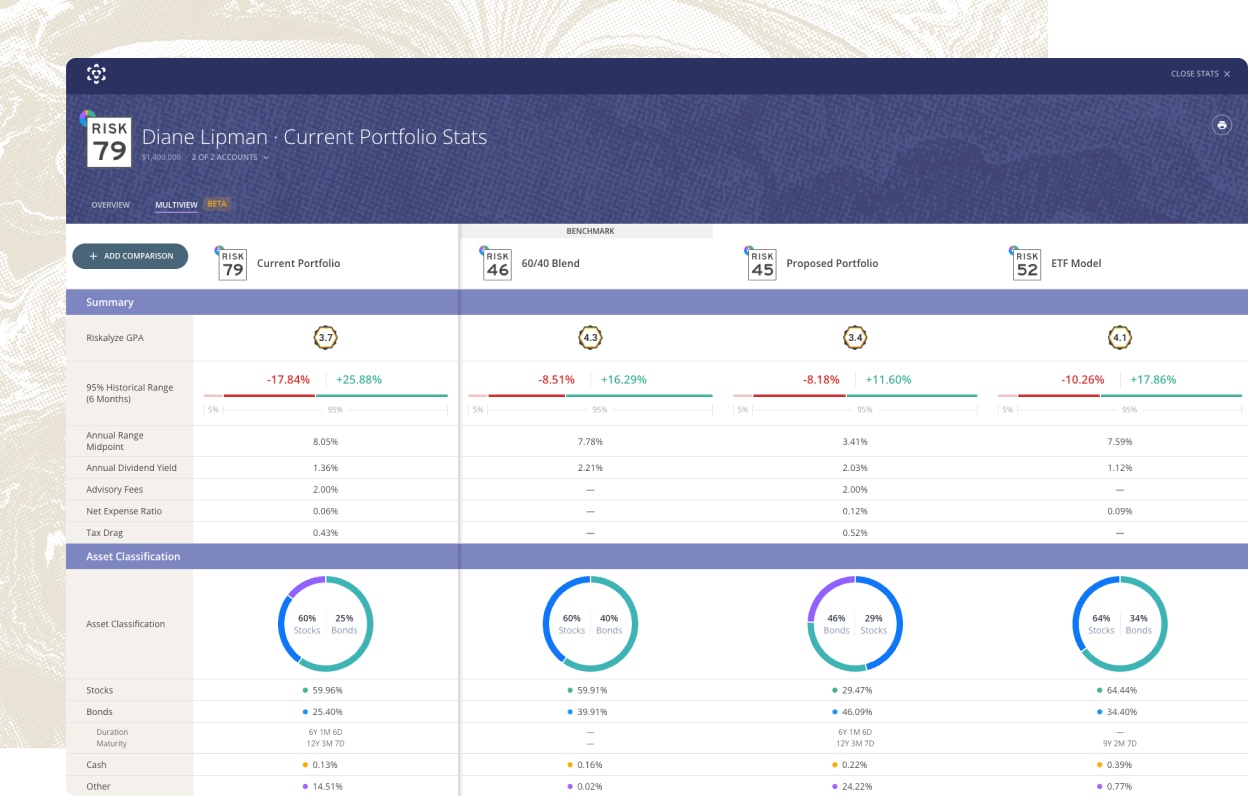
When it comes to portfolio comparisons, one size doesn’t fit all. That’s why we built Stats Multiview—a revolutionary way to compare investments side-by-side… by side… by side… and beyond. Whether you’re comparing a client’s current portfolio to a proposed strategy, stacking it up against benchmarks like a 60/40 portfolio, or layering in key indicators like SPY and AGG to highlight equity vs. fixed income, Stats Multiview provides the ultimate clarity for your conversations.
From demonstrating the superiority of your recommendation to showcasing Reasonably Available Alternatives for SEC compliance, Stats Multiview is as versatile as it is powerful. Use it to back your advice with data, explore multiple options, or simplify complex investment concepts for clients. And when it’s time to deliver the final report? The new layout integrates seamlessly with Reports Builder for a polished, professional presentation.

Uncover the full story.
With Stock Intersection, you can uncover the hidden layers of equity exposure within funds, going beyond the limitations of traditional analysis tools. From revealing underlying holdings to identifying concentrated positions, Stock Intersection empowers you to deliver deeper insights and guide every client conversation with unparalleled clarity.
Whether you’re helping a client see how individual stocks like Nvidia contribute to their portfolio or revealing concentrated positions that could impact their risk tolerance, Stock Intersection empowers you to tell the full story. Highlight key equity exposures, uncover risks, and provide actionable, data-driven insights tailored to each client.
Every tool at your disposal.
It’s never been easier to set expectations with clients, prove your fiduciary care, and grow your business.

Seamlessly import outside assets from thousands of institutions. With client credentials entered remotely or by your side, manual updates become a thing of the past.

Want to leverage the Risk Number® for your brand? We've got an interactive portal of design templates and other resources available in your Nitrogen Elite account.

A customizable report builder that lets firms control content and compliance while enabling advisors to deliver personalized, client-specific reports.

Check-in emails build a strong foundation to support your message between client reviews and give you an early warning signal when client psychology needs care.

Find the perfect investment for your clients with security analysis and fund screening. Discovery empowers you to quickly dive into your investment research based on your most important search criteria including the Risk Number®, GPA®, expense ratios, and more.

Drop a simple link onto your website or email signature to turn it into an interactive risk analysis tool and a lead capturing machine. Now you can leverage the four most powerful words in financial advice, "What's Your Risk Number?"

Effortlessly launch a remote meeting with just two clicks. Your client joins with a web browser, and you’re protected from sharing the wrong data with the wrong client.

Take advantage of our collection of free and subscription-based models and download them into your Nitrogen account. Stay up to date on the industry's best strategies!

Does an investor's risk tolerance align with how they're invested? A portfolio-wide Risk Number® and 95% Historical Range™ enable you to make investment decisions and demonstrate alignment to your prospects and clients.

Don't wonder if a client's risk preference will allow them to achieve their goals—calculate their probability and build a map to success. Illustrate the bigger picture and even uncover outside assets.

Finally, it's easy for you to use the Risk Number® to match hundreds or thousands of 401K, 457, 403B, or Simple IRA plan participants with just a few clicks. The Risk Number creates a common language, allowing you to bridge the gap between advisor and participants without flooding your to-do list.

Meet the objective metric that has paved the way to measuring the efficiency of investments not just at the fund level, but at the portfolio level as well.

Eliminate the stereotypes that have made risk tolerance useless. Use leading scientific theory to objectively pinpoint an investor's Risk Number®, whether you’re across the room or across the world.

The risk/reward heatmap pinpoints the risk and reward contribution of individual securities in accounts, allowing you to have productive conversations about risky or concentrated positions.

Run a portfolio through a market timeline and compare it to just the right benchmark to make your point.

Run portfolios through historical events like the 2008 Financial Crisis or 2013 Bull Market to help clients understand what it means to control risk or beat the market.

Unlock the power of events in Retirement Maps. See how changing your client's Risk Number®, income, or expenses over time will affect their overall risk capacity.