
Seeing Tail Risk in Nitrogen
For years, Nitrogen has helped advisors express the relationship between risk and reward. Our technology and coaching team are elite at helping advisors deepen the discussion around risk.
Tail risks include events like the 2008 Financial Crisis and COVID-19 that have a small probability of occurring, but when they do, they have a profoundly negative (or positive) impact on performance. Technically, tail risk is a form of portfolio risk that arises when the possibility that an investment will move more than three standard deviations from the mean is greater than what is shown by a normal distribution (bell curve).
Advisors use Nitrogen to present statistics in a manner that is conducive to decision making. The most common workflow in Nitrogen helps advisors align each investor’s Risk Number® with the Risk Number of the existing or proposed portfolio. Our Risk Assessments take academic work in behavior finance (Prospect Theory) and a series of risk/reward questions, using amounts specific to the investor, in order to calculate a quantification of risk preference, expressed as a Risk Number between 1-99.
Our default portfolio analysis view is a historical six-month Historical Range, using a 95% confidence interval.
In addition, Nitrogen has multiple features (Stress Tests, Scenarios, Max Drawdown, and Advanced Risk Modeling) that help advisors highlight the impacts of low probability events like 2008 or the current COVID-19 market. It’s these events that are catalysts for 5% market environments.
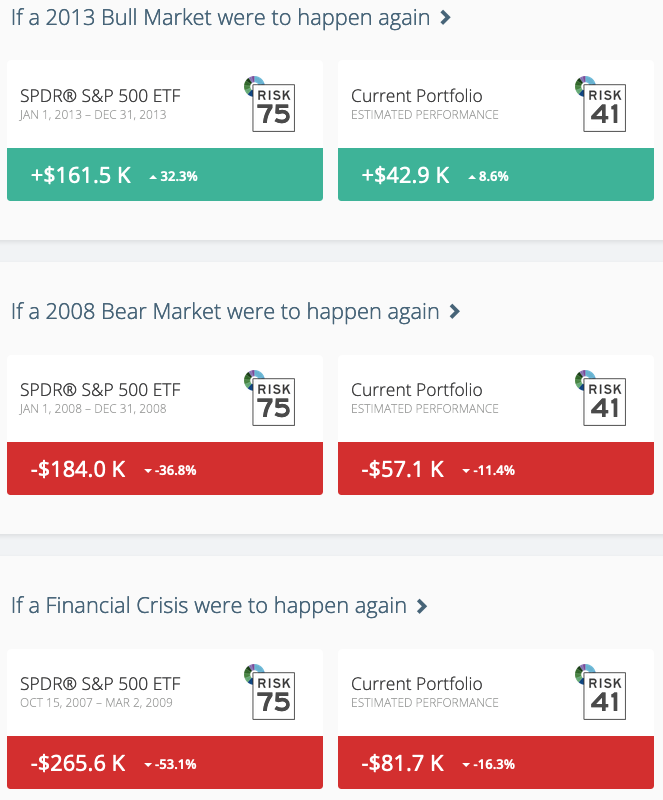
Stress Tests are one of the most popular analytics in Nitrogen. They’re one-click visuals that quantify a handful of wild market environments as “what ifs.” Advisors use Stress Tests to quantify the likely upside or downside associated with a booming or busting market. Not too long ago, advisors were using the Stress Test to overcome the objection, “why is the market beating my portfolio?” The bull market stress test helped show why a relatively low-risk portfolio shouldn’t be expected to perform like the US equity market in a raging bull market. Stress Tests can also quantify the potential downside risk associated with a portfolio if a 2008-like market were to rear its ugly head.
Example: Let’s assume you’ve designed an efficient portfolio (see GPA®) that is in alignment with an investor’s Risk Number of 41. Stress Tests can be used to highlight the likelihood of this portfolio underperforming in a bull market and protecting the investor in bear markets. “Look, we’ve confirmed that your current portfolio matches your Risk Number, has a high GPA, and Retirement Maps demonstrate that your plan has a high probability of success. Here’s how we’d expect this portfolio to act in a great market, and here’s how we’d expect it to act in a horrible market. As you can see, a Risk Number 41 portfolio won’t have the returns of the S&P 500 in a raging bull market, but it shouldn’t lose nearly as much in a horrible market…”
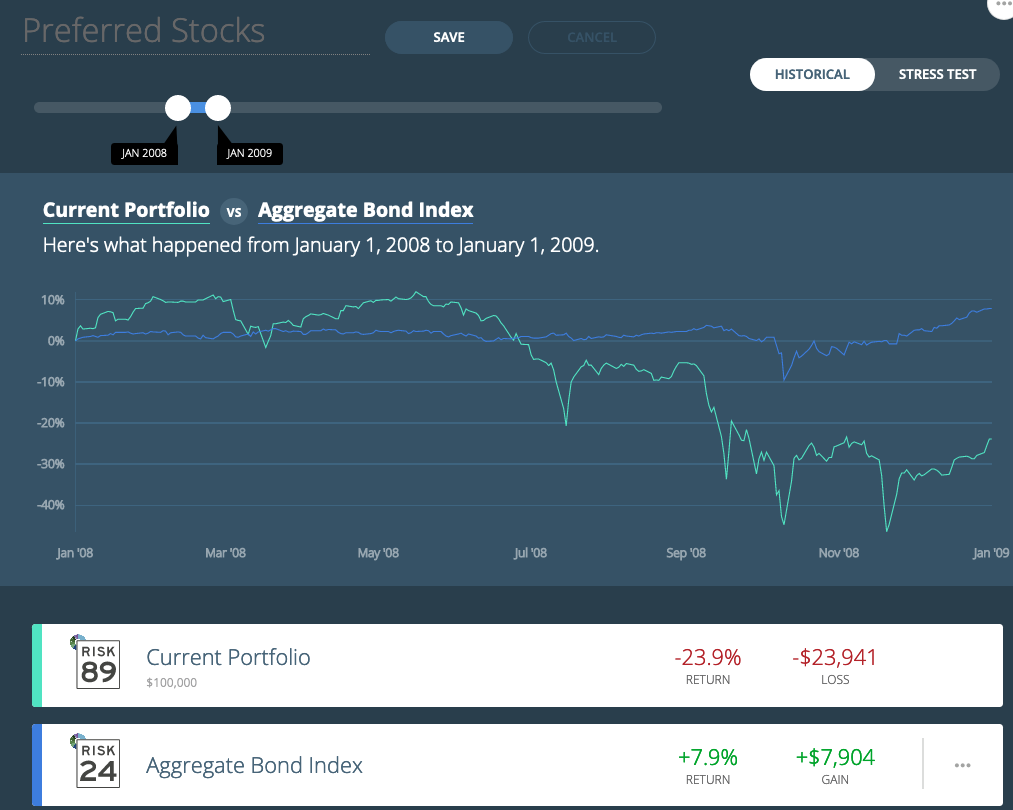
Scenarios is an interactive feature that helps you set expectations with your clients and prospects. You can dive into an interactive, historical comparison based on actual performance during any market scenario you’ve selected. Scenarios has a series of default market environments, but advisors are encouraged to design and save custom scenarios to express how a portfolio performed in the past. You may want to highlight how much risk is included in a specific asset class like Preferred Stocks by saving a “Preferred Stocks” scenario using 2008. For extra effect, you can show the preferred-stock-heavy portfolio against the aggregate bond index.
Example: “Your current portfolio is heavy in preferred stocks, and I’m suggesting that we decrease exposure to them. Here’s how preferred stocks performed back in 2008, I’d like to make adjustments to your holdings to protect against this scenario playing out in your portfolio.”
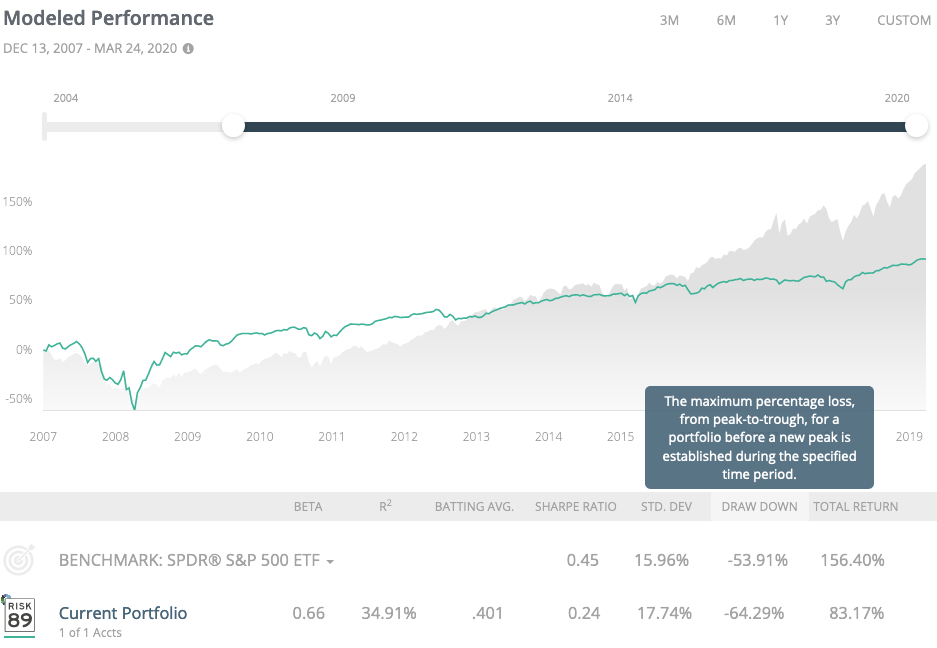
Max Drawdown: In Detailed Portfolio Stats, we dynamically calculate the maximum percent loss, from peak to trough, based on daily adjusted close prices dating back to June 1, 2004, for the portfolio. This feature has empowered our Elite users to select a variety of time periods and dynamically see the associated max drawdown. Historical occurrences are impactful in expressing the potential downside in a portfolio.
Example: Let’s assume you’ve designed an efficient portfolio that matches an investor’s Risk Number. Max Drawdown can be used to highlight how low this portfolio dropped in a historical bear market. “Look, we’ve confirmed that your current portfolio matches your Risk Number, it has a high GPA, and gives your plan a high probability of success via Retirement Maps. But, here’s how much this portfolio dropped in the past. Though history doesn’t repeat itself, I need to know you’re capable of staying invested if we are forced to hold your portfolio through a horrific market environment. Will you be able to stay fully invested if you see a drop of this size?”
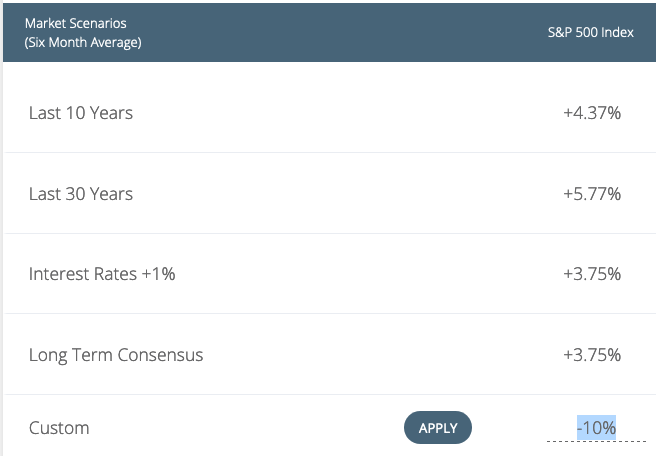
Advanced Risk Modeling: Nitrogen empowers advisors to stress test an unlimited number of “what ifs” via the Advanced Risk Modeling (ARM) feature. Enabling Nitrogen’s Advanced Risk Modeling feature provides advisors with control over the capital market assumptions for the US equity market and 10 year US Gov bond yield. By entering custom inputs, advisors can take any number of macro economic data points to generate capital market assumptions for the US Equity and Bond market. When ARM is used, Nitrogen calculates the 95% Historical Range based on historical data in conjunction with capital market assumptions. It’s drop-dead simple to enter dire market assumptions to quantify the impact on the portfolio’s risk and return metrics. For example, entering a negative US Stock market assumption will drive the Risk Number up on equity-heavy portfolios.
Advanced Risk Modeling Example: Should you want to run an impromptu stress test for a bad market environment, select Advanced Risk Modeling and enter a poor market assumption, and Nitrogen will update the analysis accordingly. Here’s an example of entering a custom 10% US Equity market drop. Enter -10%, select “apply,” and Nitrogen will recalculate the 95% Historical Range, Risk Number, and GPA accordingly.

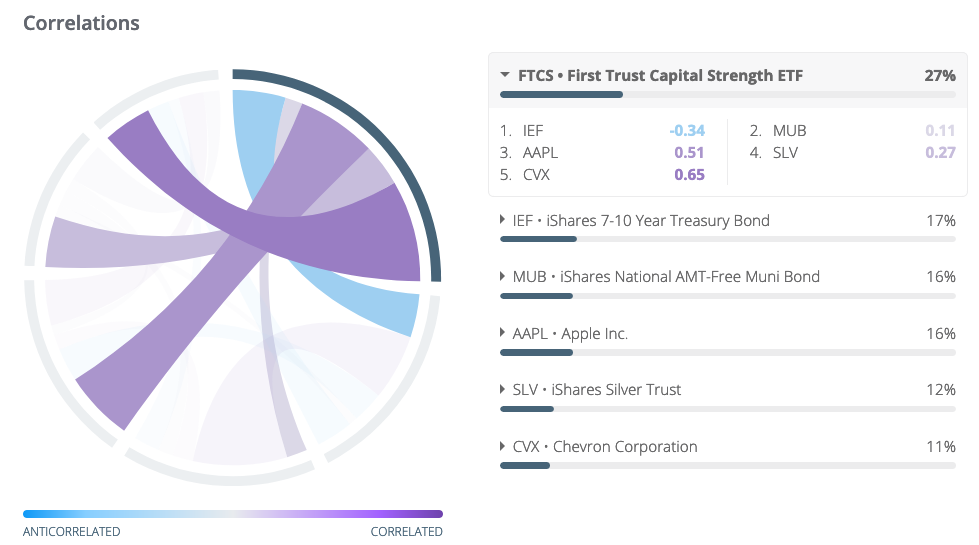
Risk/Reward Heatmap and Correlation Analytics: Nitrogen’s Risk/Reward Heatmap is a powerful feature in portfolio construction and review for portfolios. Many Advisors use the Risk/Reward Heatmap with clients to demonstrate the diversification of their portfolios. This intuitive view can highlight which investments are bringing the most historical risk and return to the portfolio. Often the Risk/Reward Heatmap is used in conjunction with the dynamic correlation analytics found in Detailed Portfolio Stats. The Risk/Reward Heatmap, correlation chord diagram, Risk Number, and GPA are used to identify which investments are having the largest potential impacts (including hedging) on the portfolio’s risk and return.